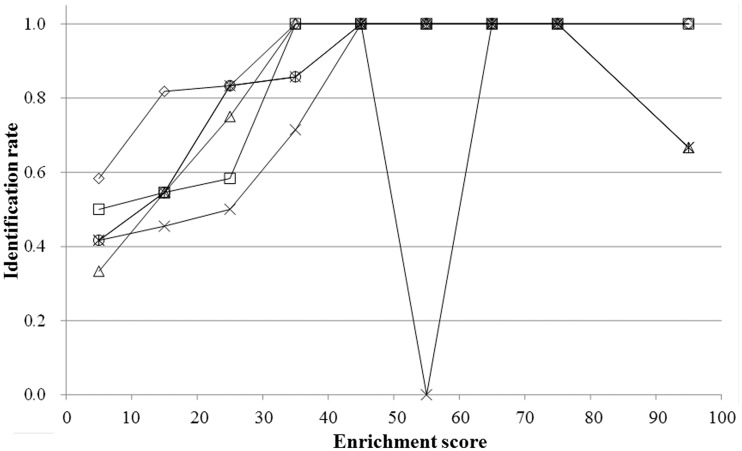
Figure 9.
For the 65 yeast datasets, the rates of successful identification, defined as Ranks 1 and 2, are shown with the respect to the enrichment scores employing the results obtained by our system (rhombuses), BioProspector (triangles), MEME (crosses), MDscan (squares), DME (asterisks) and Weeder (circles). Note that in the datasets, there is one sample in the 50–60 enrichment score range.

