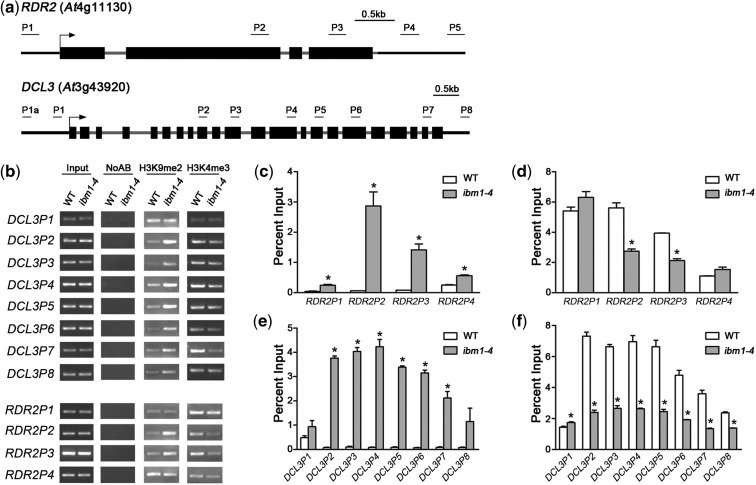
Figure 2.
IBM1 controls the chromatin modification state at RDR2 and DCL3. (a) Schematic genetic structures of RDR2 and DCL3 and of the regions used for RT-PCR and real-time qPCR after ChIP. The black boxes represent exons; the gray lines represent introns or 3′-UTRs. (b) Detection of the H3K9me2 and H3K4me3 levels in RDR2 and DCL3 chromatin by RT-PCR following ChIP. ChIP was conducted using antibodies against H3K9me2 and H3K4me3. Plants of each genotype were grown under LD conditions for 10 days before harvest for ChIP. Input, chromatin before IP; NoAB, control samples without antibodies in the IP steps. (c–f) qPCR analysis of the H3K9me2 ([c] and [e]) and H3K4me3 levels ([d] and [f]) at RDR2 and DCL3, respectively. Our results for WT and ibm1-4 are normalized to the input. The results from three biological replicates are shown; error bars represent the S.E. Asterisks indicate a significant difference using Student’s t-test (P < 0.05).

