Figure 5.
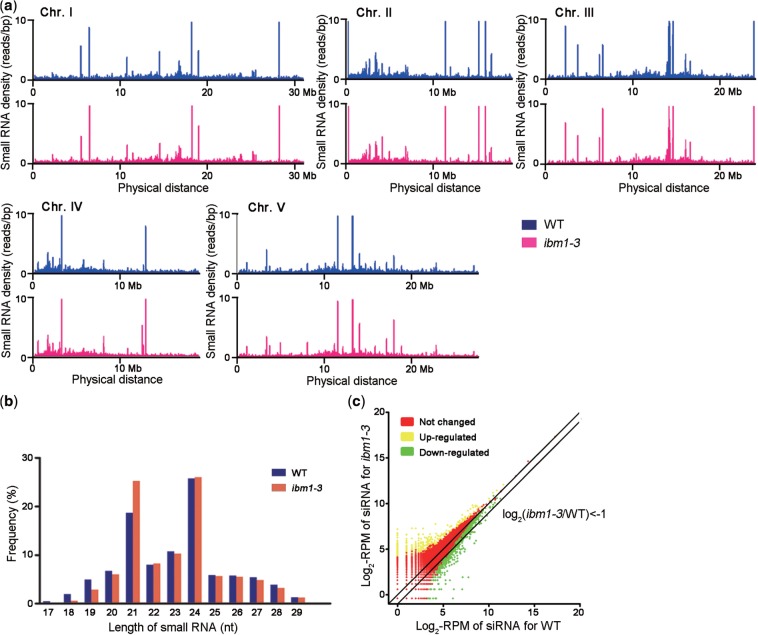
Small RNA sequencing in WT and ibm1 plants. (a) Scrolling-window analysis of small RNAs in ibm1-3 and WT. The reads produced by Illumina sequencing were mapped to the Arabidopsis genome, and the small RNA density distributions in 100-kb sliding windows with a 50-kb slide were counted along the chromosomes and are shown as the read number per bp. Bars with >10 reads/bp are not shown in this figure. (b) Comparison of the size distribution of small RNAs in WT and ibm1-3. The percentage of reads of a given length in all small RNA reads was calculated. (c) Scatterplot comparing the amounts of endogenous siRNAs generated from each locus between ibm1-3 and WT. The number of siRNA reads for each locus was counted and normalized to the scale of the libraries. RPM: reads per million.

