Figure 1.
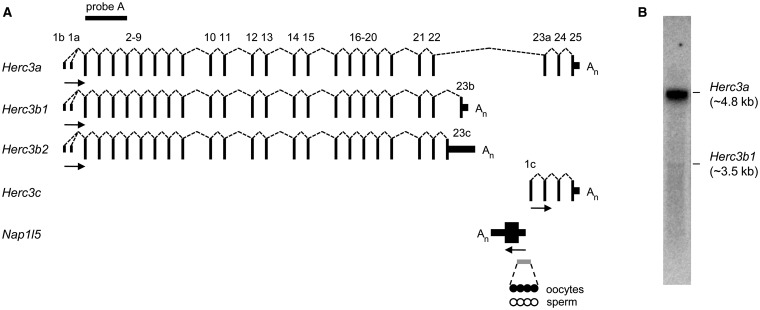
Transcription at the Herc3/Nap1l5 locus. (A) Transcripts at the locus, as determined by 3′ RACE, RT-PCR, northern blotting and expressed sequence tag data. Exons (numbered) are shown as non-coding (short vertical lines or solid boxes) or coding (tall vertical lines). Splicing events are illustrated by dashed lines. The direction of transcription is illustrated by horizontal arrows and polyadenylation sites by An. The gray bar represents the gDMR at the Nap1l5 promoter, that is methylated in oocytes (filled circles) and unmethylated in sperm (open circles). The position of probe A used in northern blotting is shown by a black bar. The diagram is not drawn to scale. (B) Northern blot of 2-week brain RNA using probe A, illustrating the relative abundance of transcripts utilizing the Herc3a and Herc3b1 poly(A) sites.

