Figure 3.
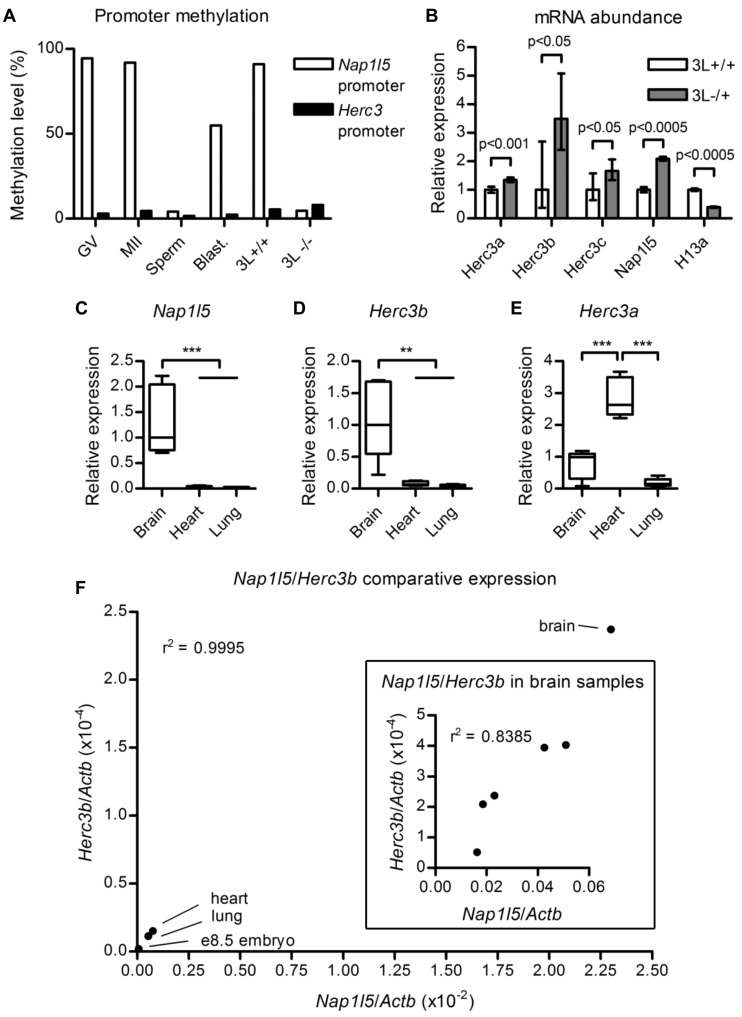
Methylation and transcription analyses. (A) Percentage methylation at the internal Nap1l5 promoter and the 5′ Herc3 promoter in gametes and blastocyst (blast.). GV, germinal vesicle oocytes; MII, metaphase II oocytes. GV oocytes derived from females deficient for Dnmt3L (3L−/−) are hypomethylated at the Nap1l5 promoter relative to wild-type controls (3L+/+). The data are derived from a reduced representation bisulfite sequencing experiment performed in (24). (B) mRNA abundance determined by qRT-PCR on pooled Dnmt3L−/+ (3L−/+) e8.5 embryos relative to wild-type littermates (3L+/+), normalized to Actb. The mean values from three technical replicates are presented for each transcript. Error bars indicate the 95% confidence interval. Probability values were calculated using Student’s t test. (C) Relative abundance of Nap1l5 transcripts in brain, heart and lung. The bottom and top of the box represent the 25th and 75th percentiles, respectively; the internal line represents the median; and the whiskers represent the range of the data. Transcript abundance between the tissues was assessed using one-way analysis of variance. **P < 0.01, ***P < 0.001. (D,E) Relative abundance of Herc3b and Herc3a transcripts, as for (C). (F) Main image: Relationship between Nap1l5 expression level and use of the Herc3b1 poly(A) site in brain, heart, lung and wild-type e8.5 embryo. Inset: Association between the natural variation of Nap1l5 expression and use of the Herc3b1 poly(A) site in the brains of Day 1 littermates. Data points in the main graph indicate median values for each tissue, except for e8.5 embryo for which only one biological sample was assayed, representing cDNA from pooled embryos; this value corresponds to the mean of three pipetting replicates. Data points in the inset graph represent mean values from three pipetting replicates performed for each sample.

