Figure 6.
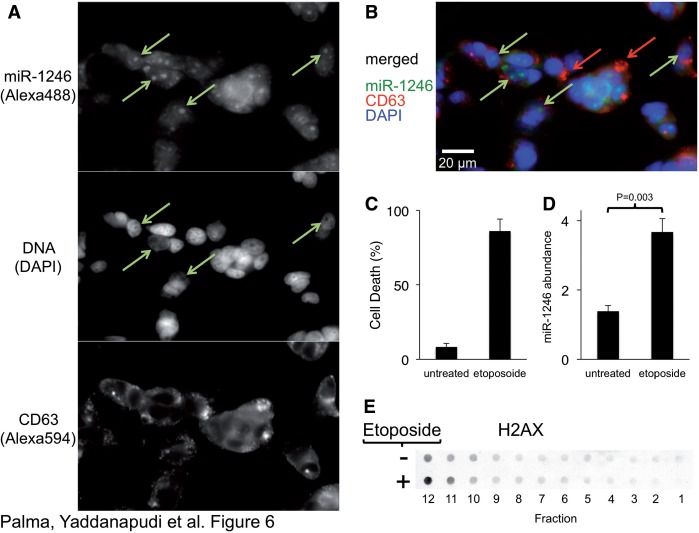
MiR-1246 associates with nucleosomes. (A) MCF7 cells were probed for miR-1246 using miRCURY LNA probes (top panel) and for CD63 using antibodies (middle panel) and dyed for DNA (with DAPI, middle panel). Arrows indicate DAPI-negative regions of the nucleus (nucleoli). (B) Overlay of the individual probes. Green arrows indicate enriched miR-1246 populations, and red arrows indicate CD63 domains. (C) MDA-MB-231 cells were treated with etoposide, and cell death was quantified using trypan blue (n = 7). (D) Exported miR-1246 abundance was measured by TaqMan qRT–PCR. The two-tailed P value was calculated by paired T-test (n = 4). (E) Probing of P70 gradient fractions with H2Ax on untreated and etoposide-treated MDA-MB-231 cells. Supplementary Figure S5 shows probing of these cells with an rRNA probe for comparison of subcellular location of these RNA species.

