
Figure 1.
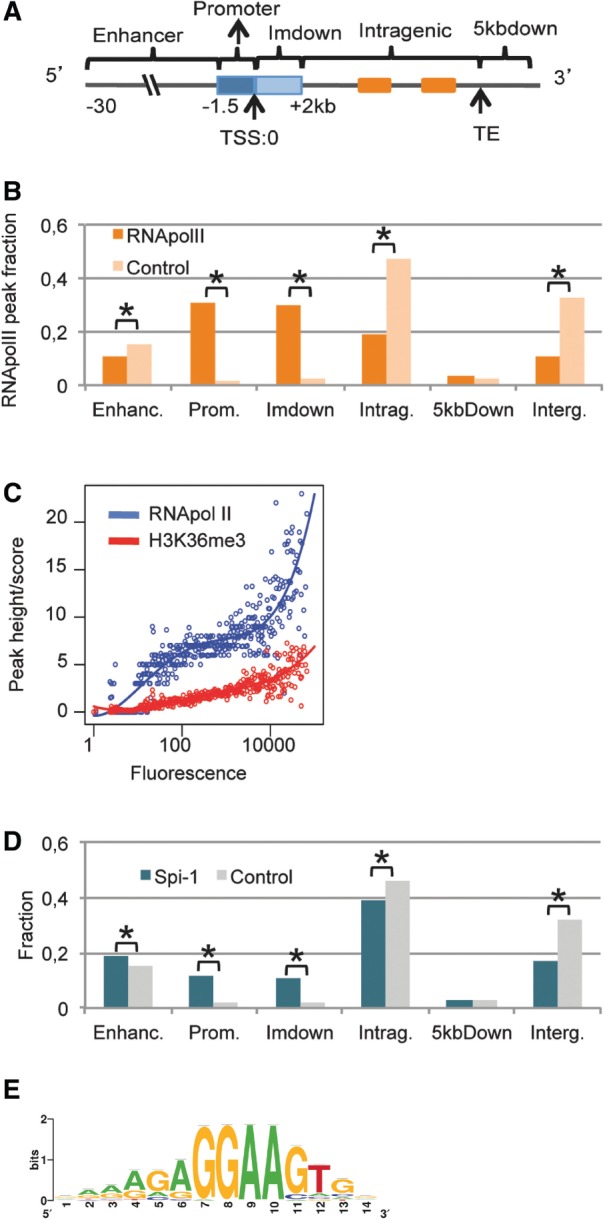
Spi-1 and RNA Pol II exhibit preferential binding in the genome. (A) The definition of each genomic region is described. (B) The histograms represent the distribution of RNA Pol II peaks location relative to the nearest TSS. See the Methods section for details. χ2 test; Asterisk indicates P < 10−3. (C) The median peak height of RNA Pol II in the promoter or ImDown subregions (−1.5 kb + 2 kb) or score of H3K36me3 (y-axis) versus the gene expression levels measured by the median fluorescence using microarray data (x-axis). Each y-value was calculated for an interval of fluorescence. The solid curve is a fit with a polynomial of degree 4 by robust regression using an M estimator from the R package MASS and the ‘rlm’ function: http://cran.r-project.org/web/packages/MASS/MASS.pdf). (D) The histograms represent the distribution of the total Spi-1 and control peaks in the murine genome. See the ‘Materials and Methods’ section for details. χ2 test; Asterisk indicates P < 10−3. (E) Sequence logos of the PWM produced by ChIPMunk software using all 17 781 Spi-1 peak sequences generated using WebLogo are shown; the PWM threshold corresponds to a FDR of 10%.