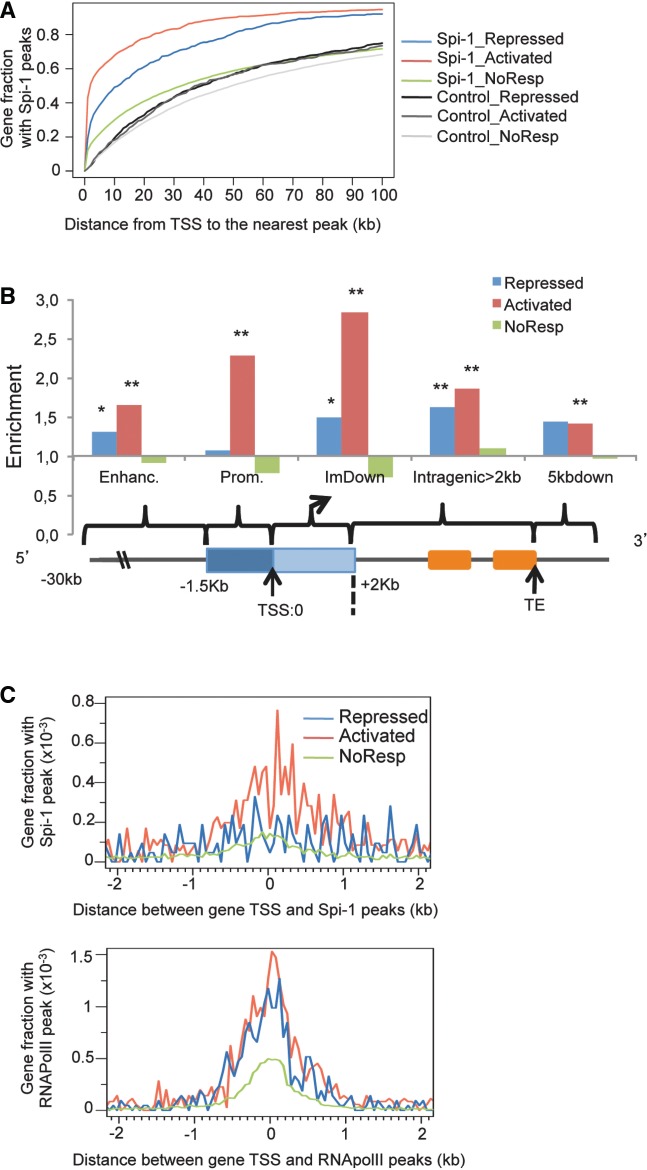
Figure 3.
Combination of ChIP-seq and gene expression analysis reveals a distinct Spi-1 peaks localization in activated and repressed genes. (A) Cumulative distribution of the distance between a gene TSS and the nearest Spi-1 or the control (Input and IgG) peaks for the different transcriptional response categories. (B) The histograms represent the enrichment of Spi-1-bound genes of each transcriptional category with respect to the total number of Spi-1-bound genes within each class of the subregion. Statistical analyses versus the total number of genes were performed using the χ2 test; Asterisk indicates P < 10−3; Double asterisk indicates P < 10−10. (C) Distribution of the distance from the Spi-1 and RNA Pol II peaks to the nearest gene TSS, as determined by the hierarchy model, in each transcriptional response category. The distributions on each side of the TSS within 50-bp windows are reported.

