Figure 4.
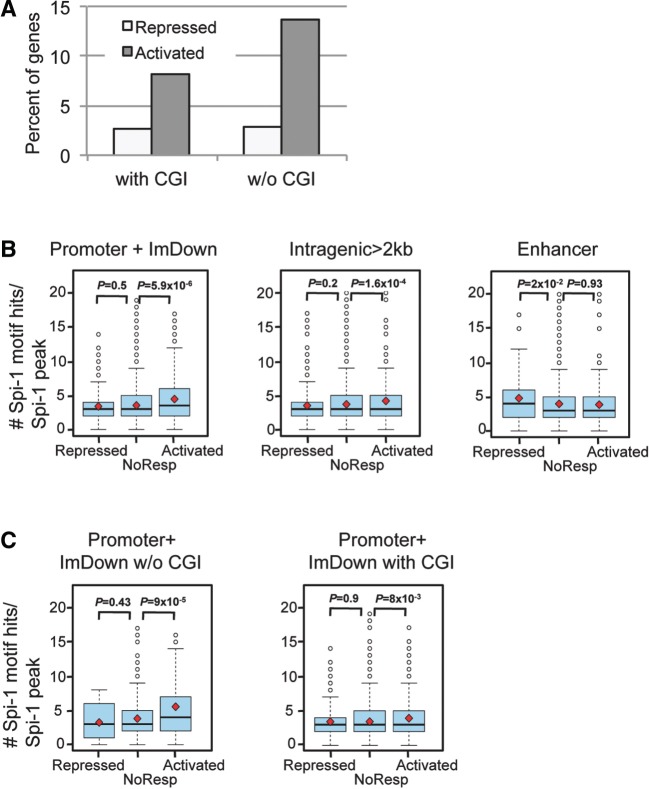
Clustering of Spi-1 binding is associated with transcriptionally activated genes and occurs mainly in promoters devoid of CGIs. (A) Spi-1 occupancy in the promoter + ImDown subregions devoid of CGI increases the probability to positively influence gene transcription. The histograms represent the percentage of the repressed or activated genes when Spi-1 peaks are within promoter + ImDown subregions that contain (with CGI) or not (w/o CGI) CGIs. (B) Distribution of the number of ChIPMunk-defined Spi-1 motif hits per Spi-1 peak in the promoter + ImDown, intragenic and enhancer subregions according to Spi-1 transcriptional activities. The red square indicates the mean, and the black line inside the box plot indicates the median. The Wilcoxon test was used to statistically examine the differences in the distributions of the number of Spi-1-motif hits. P < 0.05 was considered statistically significant. (C) Distribution of the number of ChIPMunk-defined Spi-1-motif hits per Spi-1 peak sequence in the promoters + ImDown subregions that contain (with CGI) or not (w/o CGI) CGIs and according to Spi-1 transcriptional activities. The red square indicates the mean, and the black line inside the box plot indicates the median. The Wilcoxon test was used to statistically examine the differences in the distributions of the number of Spi-1-motif hits. P < 0.05 was considered statistically significant.

