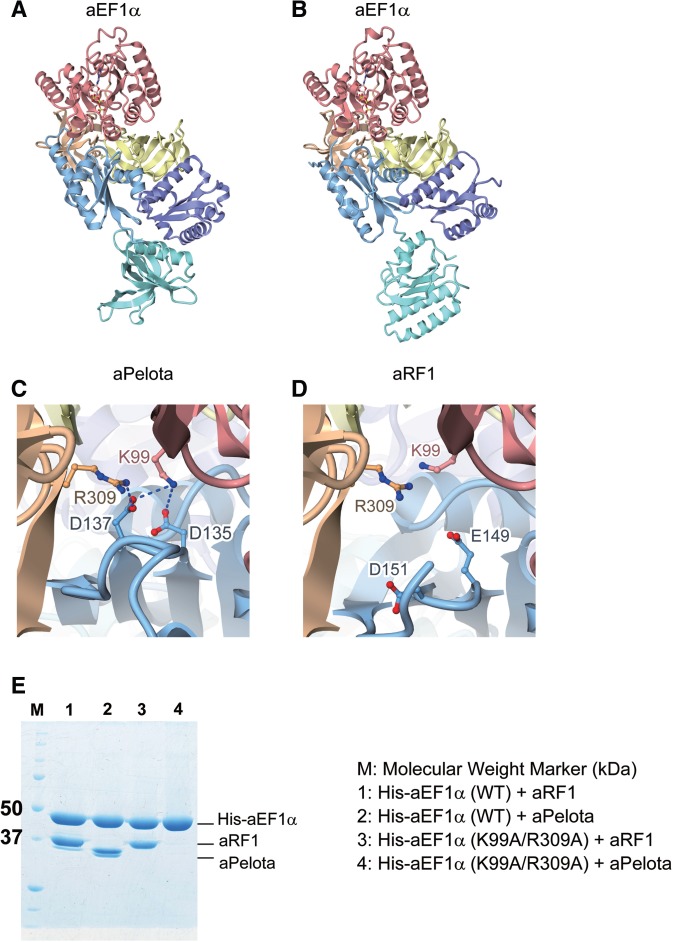
Figure 5.
Comparison of the complex structure of aRF1·aEF1α·GTP with that of aPelota·aEF1α·GTP. Domains are color-coded as in Figure 1. (A) aPelota·aEF1α·GTP complex structure (PDB ID: 3AGJ). (B) aRF1·aEF1α·GTP complex structure (this work). (C) The interaction interface between aPelota and aEF1α. Lys99 and Arg309 of aEF1α, and Asp135 and Asp137 of aPelota are depicted by ball-and-stick models. (D) The interaction interface between aRF1 and aEF1α. Lys99 and Arg309 of aEF1α, and Glu149 and Asp151 of aRF1 are depicted by ball-and-stick models. (E) In vitro binding assay of wild-type (WT) and mutant (K99A/R309A) aEF1α to aRF1 and aPelota. His-tagged aEF1α (His-aEF1α) was mixed with aRF1 or aPelota, immobilized by MagneHis™ Ni particles and then eluted. Eluted fractions were analyzed by SDS–PAGE.

