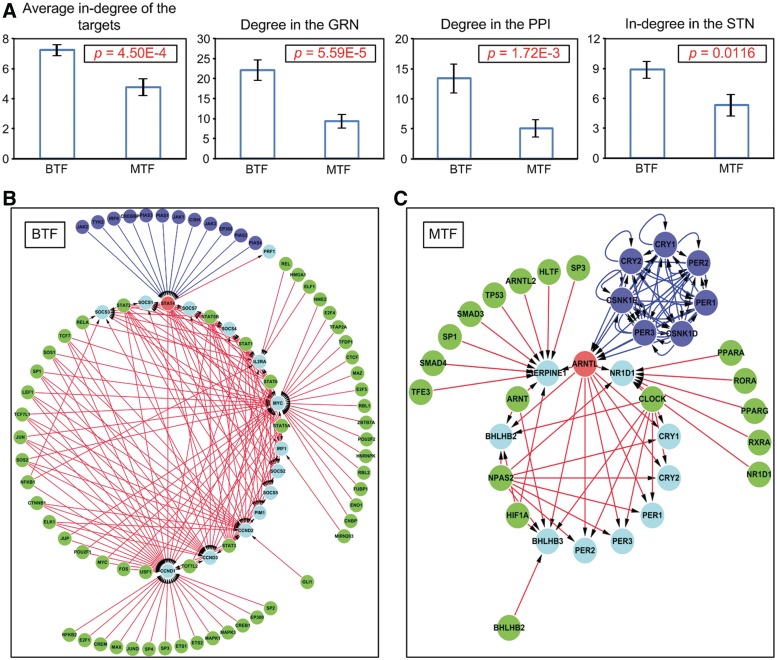
Figure 4.
Two types of TFs. (A) Topological properties of the two types of TFs. Error bars denote standard errors. (B) An example of a BTF-centered network. (C) An example of an MTF-centered network. In the example networks of (B) and (C), red nodes denote BTFs or MTFs; cyan nodes denote the TGs of the red nodes; green nodes denote other TFs targeting the cyan nodes; blue nodes denote upstream signaling proteins of the red nodes; blue lines denote signal transduction and red lines denote genetic regulation.

