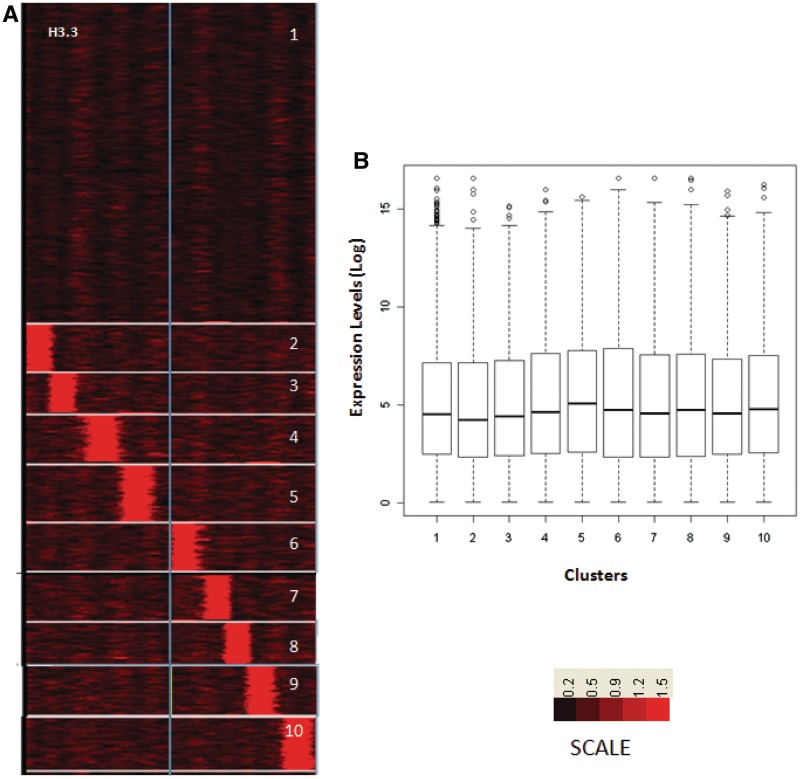
Figure 6.
H3.3 occupancy is not correlated to gene expression level. (A) Clustering of genes according to the ChIP-seq counts around the TSS for H3.3 occupancy profiles from crosslinked chromatin. (B) Log-transformed and normalized gene expression values in liver, inferred from GNFatlas data, is represented as box plots for each cluster from (A).

