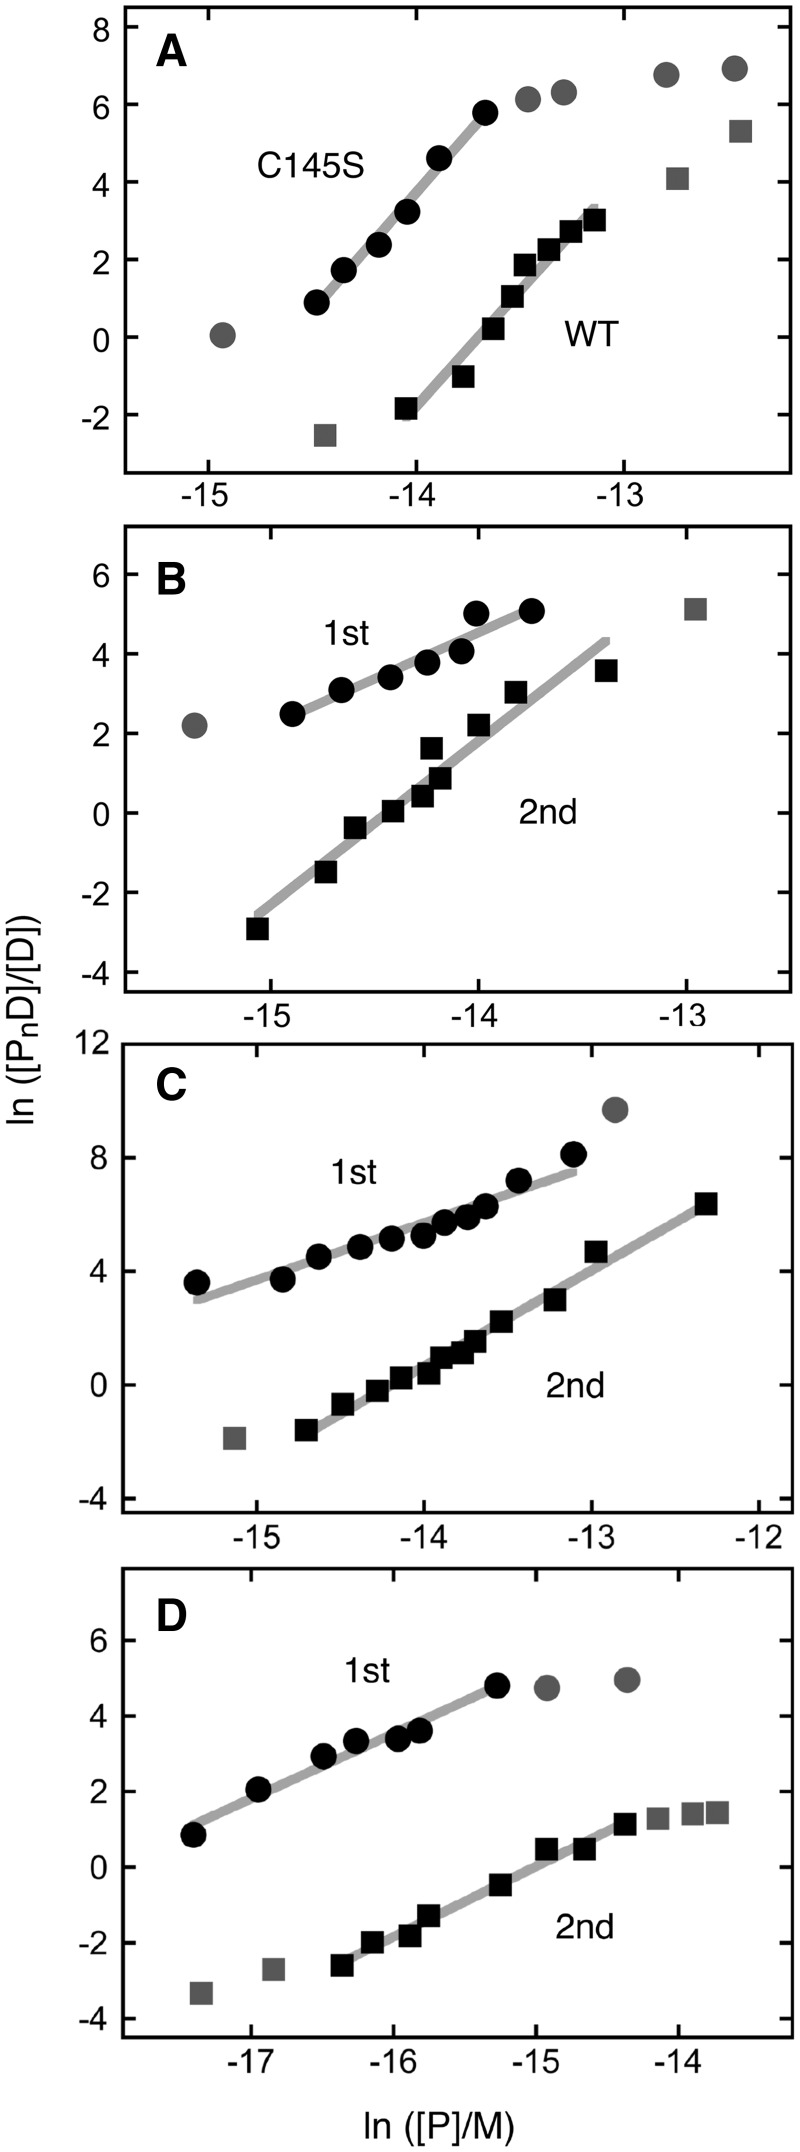
Figure 2.
Graphs of the dependence of log[PnD]/[D] on log[P] for AGT-complexes with duplex DNAs. Data are from the experiments shown in Figure 1 and others that provide additional [AGT] values. The lines represent least-squares fits to the data ensembles for the ranges about the midpoint of each reaction, with [AGT]free calculated as described in Experimental Procedures. Symbols: the points used in the fit are indicated by the black symbols; other points in the data sets are indicated by grey symbols. (A) Data from titrations of unmodified double stranded 26 bp DNA (oligos 1 + 3) with C145S-AGT (filled circle; displaced upward 3 units for clarity) and wild-type AGT (filled square). The slopes are 5.97 ± 0.49 and 6.09 ± 0.32, respectively. (B) Data from titration of 6mG-containing double stranded 26 bp DNA (oligos 2 + 3) with alkyltransfer-active P140K-AGT. First binding step (filled circle; points displaced upward 4 units for clarity); second binding step (filled square). The slopes are 2.33 ± 0.29 and 4.11 ± 0.34, respectively. (C) Data from titration of 6mG-containing double stranded 26 bp DNA (oligos 2 + 3) with C145S-AGT. First binding step (filled circle; points displaced upward 5 units for clarity); second binding step (filled square). The slopes are 2.01 ± 0.19 and 3.37 ± 0.12, respectively. (D) Data from titration of 6mG-containing double stranded 24 bp DNA (oligos 4 + 5) with C145S-AGT. First binding step (filled circle; points displaced upward 3 units for clarity); second binding step (filled square). The slopes are 1.72 ± 0.14 and 1.86 ± 0.09, respectively.

