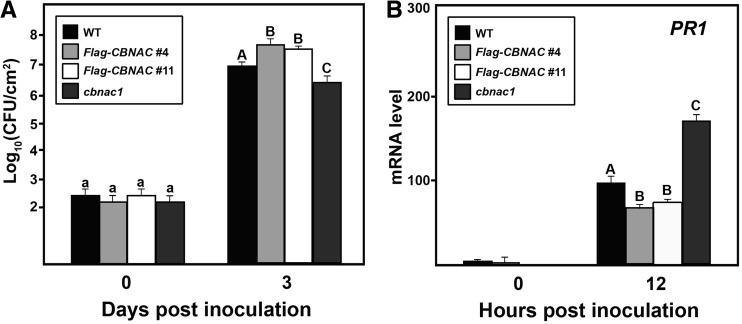
Figure 2.
CBNAC negatively regulates resistance to PstDC3000 and PR1 expression. Leaves of wild type (WT), 35S:Flag-CBNAC and cbnac1 plants were inoculated with a bacterial suspension (OD600 = 0.001 in 10 mM MgCl2). (A) Growth of PstDC3000 in inoculated leaves at 0 and 3 dpi. Mean bacterial densities ± SE were calculated from six to eight replicate plants are shown. Significant differences as calculated by Student’s t test (P < 0.05) are indicated by unique letters. The experiment was repeated at least three times with similar results. (B) qRT-PCR analysis of PR1 expression in inoculated leaves. Values were normalized using the expression level of Tubulin 2 and expressed relative to the expression level in WT at 12 hpi, which is arbitrarily set at 100. Mean relative expression values ± SE from three independent experiments are shown. Data were analyzed by Student’s t test. Different letters indicate statistically significant differences between genotypes (P < 0.05).

