Figure 5.
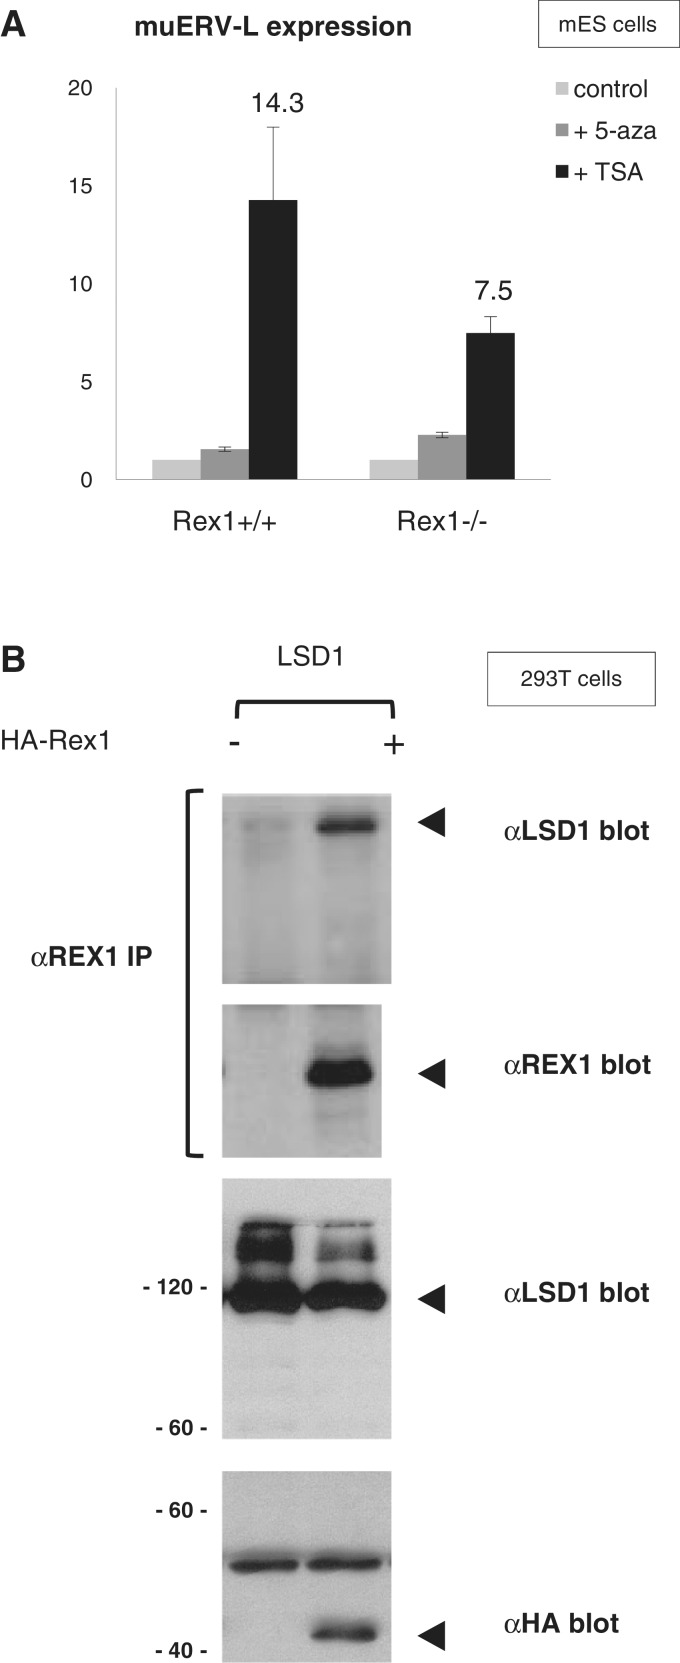
Association of REX1 and LSD1 proteins. (A) Expression levels of muERV-L. Rex1+/+ or Rex1−/− ES cells were treated with TSA or 5Aza for 24 h. Levels of muERV-L expression were determined by qRT–PCR as explained in the legend to Figure 2C. Results are depicted as fold expression in each cell line after normalization to Gapdh. The fold change was then plotted relative to untreated cells, with error bars representing SD. The fold muERV-L induction by TSA in Rex1+/+ versus Rex1−/−cells was 1.90. (B) Human kidney 293T cells were co-transfected with a plasmid expressing HA-tagged-intact REX1 proteins as indicated, in combination with a plasmid expressing LSD1/Kdm1a. Proteins were immunoprecipitated with αREX1 antibodies and analysed by western blot (top panels) together with proteins in total extracts (bottom panels) with monoclonal αHA antibody, αREX1 antibodies or αLSD1 antibodies as indicated on the right. Bands corresponding to HA-REX1 or LSD1 are marked on the right, protein molecular weight markers are indicated to the left in the bottom panels.

