
Figure 1.
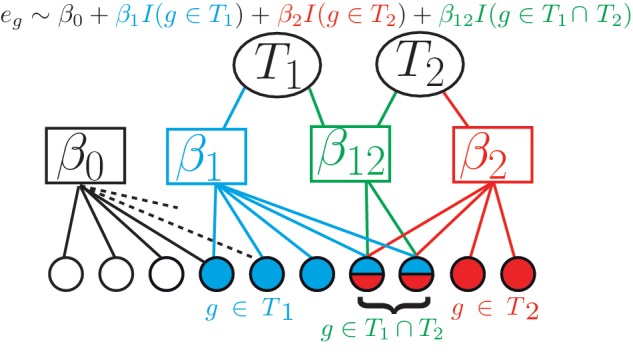
Schematic description of the linear regression model: for two TFs T1 and T2, expression of all genes that are targets of T1 is described by coefficient β1 (cyan), expression of genes that are targets of T2 is described by coefficient β2 (red) and expression of genes that are targets of both TFs is described by coefficient β12 (green). β0 (white) is the coefficient for the baseline activity. It is connected to all genes including those that are targets of neither T1nor T2 (white circles). Remaining connections are symbolized by dotted lines. Circles at the bottom symbolize genes and are colored according to the TF that targets them. The whole formula of the logistic linear regression is shown at the top, with the relevant parts highlighted at the bottom. For a detailed description of the model, refer to ‘Materials and Methods’ section.