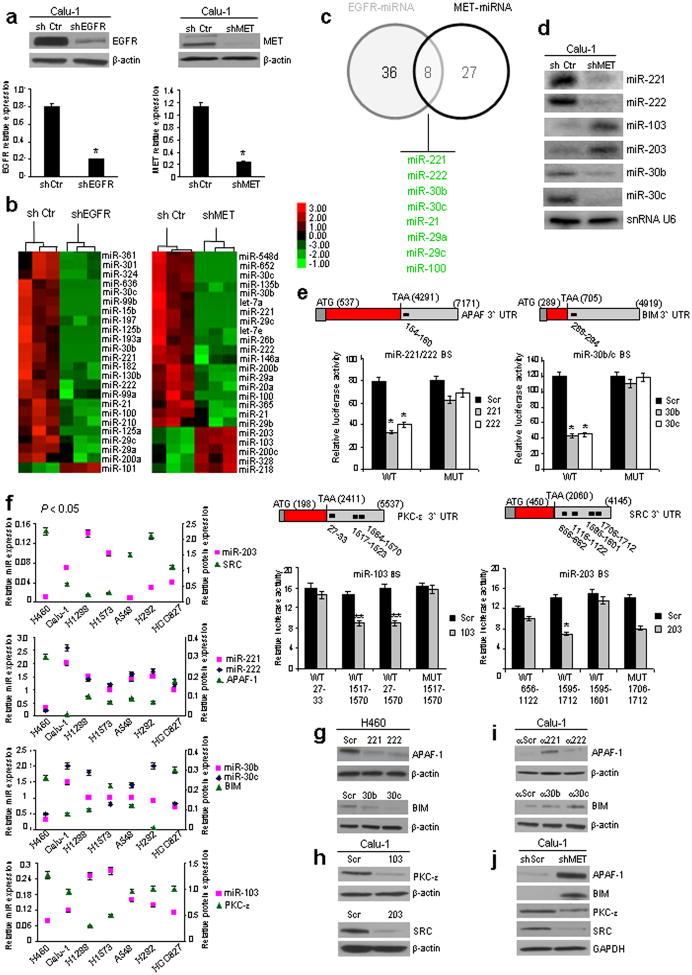
Figure 1. MiR-221-222, 30b-c, 103, 203 target APAF-1, BIM, PKC-ε and SRC.
(a) EGFR and MET proteins and mRNAs down-regulation after EGFR and MET silencing. (b) Unsupervised hierarchical clustering based on miRNA expression profiles in shControl versus shEGFR and shMET-Calu-1 cells at a p value <0.05. (c) Intersection of shEGFR and shMET regulated microRNAs. (d) Northern blots showing miR-221,-222, 103, -203, -30b, and -30c deregulation after MET knockdown. SnRNA U6, loading control. (e) Decreased luciferase activity indicated direct miR-PKC-ε, SRC, APAF-1 and BIM 3′ UTR interactions (Fig. 1e) and target gene repression was rescued by mutations or deletions in the complementary seed sites. In the case of SRC only the site 1595-1601 is implicated in the binding with miR-203; deletion of the site 1706-1712 did not rescue luciferase activity (See also Supplementary Fig. 2). Relative repression of firefly luciferase expression was standardized to a transfection control. (f) Inverse correlation between miR-103,-203, 221-222 and -30b-c and target proteins in a panel of NSCLC cells. Correlation coefficients of -0.91 (miR-203/SRC), -0.92 (miR-221/APAF-1), -0.90 (miR-222/APAF-1), -0.55 (miR-30b/BIM), -0.91 (miR-30c/BIM), -0.87 (miR-103/PKC-ε), P<0.05. (g) MiR-221&222, miR-30b-c overexpression decreased endogenous levels of APAF-1 and BIM. (h) MiR-103 and miR-203 overexpression decreased endogenous levels of PKC-ε and SRC. (i) Anti-miR-221-222 and anti-miR-30b-c increased APAF-1 and BIM expression. (j) MET knockdown induced APAF-1 and BIM upregulation and SRC and PKC-ε down-regulation. Results are representative of at least, three independent experiments. Error bars depict ± s.d. * P< 0.001, ** P< 0.05 by two tailed student's t test.

