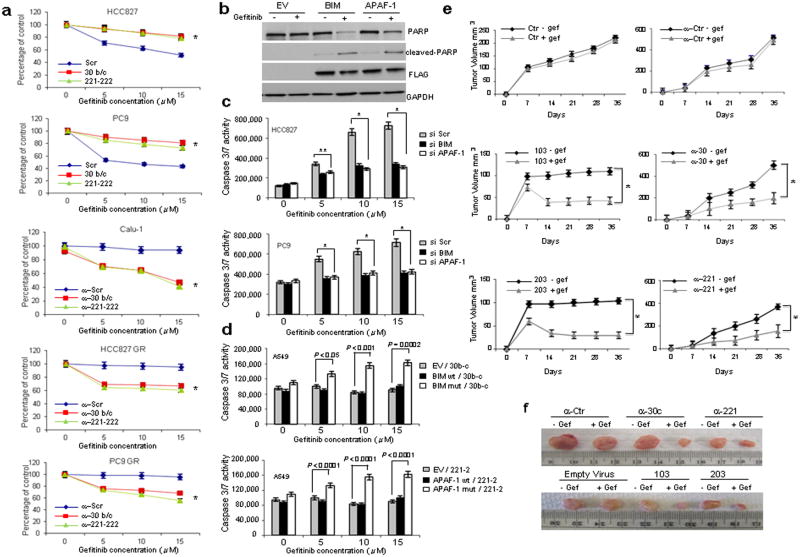
Figure 4. MiR-30b-c, 221-222, 103, 203 regulates gefitinib sensitivity.
(a) Parental and resistant HCC827 GR and PC9GR and Calu-1 cells treated with increasing concentrations of gefitinib. Each data point represents the mean ± s.d of 6 wells. (b) Western blot showing an increase in PARP cleaved fragment after BIM and APAF-1 over-expression and gefitinib treatment (15μM) in A549 cells. (c) BIM and APAF-1 silencing in HCC827 and PC9 cells reduces the response to gefitinib. (d) Overexpression of miR-30b/c- and -221/222-insensitive BIM and APAF-1 cDNAs, induces gefitinib sensitivity in A549 cells. (e-f) MiR-103, -203 overexpression and miR-30c, -222 silencing increase gefitinib sensitivity in vivo. (e) Growth curve of engrafted tumors and (f) comparison of engrafted tumors in nude mice injected with A549 cells stable infected with anti-miR-control (ctr), anti-30c, anti-221 and with miR-103 and -203 or an empty virus as control. The images show average-sized tumors from among five of each category. In a, c, d and e error bars indicate ± s.d. *P < 0.001, **P < 0.05 by two tailed student's t test.

