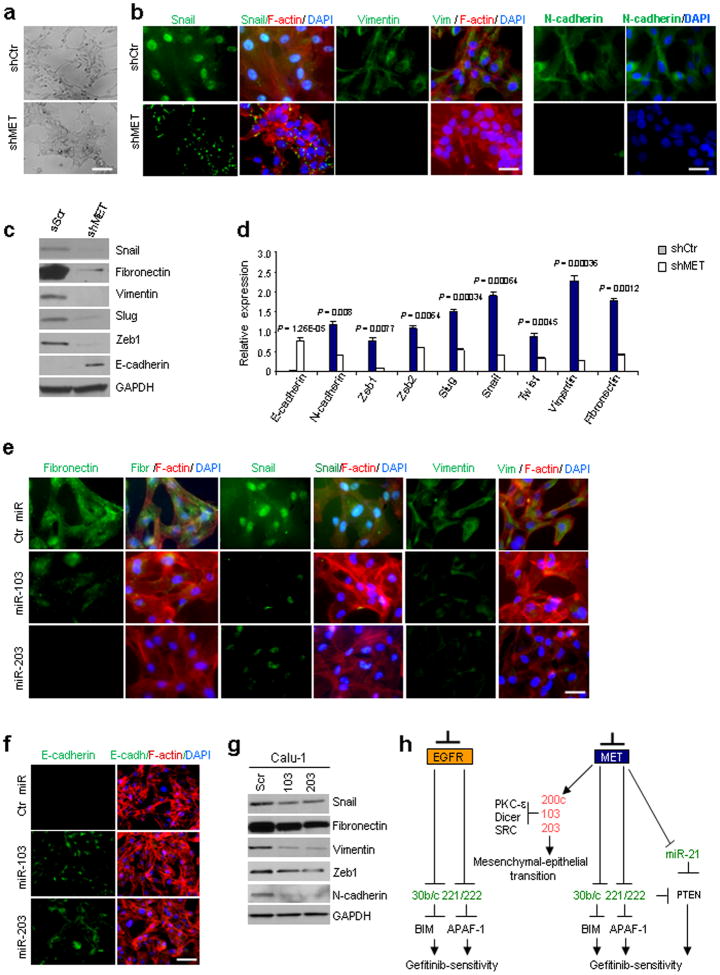
Figure 6. c-Met knockdown induces MET through miR-103 and -203.
(a) Morphological changes of Calu-1 cells after MET knockdown. Scale bar indicates 20μm. (b) Immunofluorescence: Snail, mesenchymal intermediary filament vimentin and N-cadherin in Calu-1 shControl and Calu-1 shMET. Snail expression is strong and nuclear in Calu-1 ShCtr and is weaker and cytoplasmic in Calu-1 ShMET. Scale bar, 20μm. (c) Western blots showing the downregulation of mesenchymal proteins as fibronectin, vimentin and Snail and the upregulation of E-cadherin after MET knockdown in Calu-1 cells. Loading control, GAPDH. (d) qRT-PCR showing the expression of epithelial and mesenchymal markers in Calu-1 ShCtr and Calu-1 shMET. (e) Immunofluorescence: fibronectin, Snail and vimentin expression decreases after miR-103 or -203 overexpression in Calu-1 cells. Scale bar indicates 20μm. (f) Immunofluorescence: E-cadherin increased signal after miR-103 or -203 enforced expression in Calu-1 cells. Scale bar, 40μm. (g) Immunoblot showing the down-regulation of mesenchymal markers after miR-103 or -203 overexpression. (h) A model is reported in which MET inhibition elicits upregulation of miR-103 and -203, which in turn, downregulating PKC-ε, Dicer and SRC, induce gefitinib-sensitivity and mesenchymal-epithelial transition (MET). MET knockdown induces also miR-30b/c, -221/222 and -21 downregulation and consequent gefitinib-sensitivity through BIM, APAF-1 and PTEN upregulation. EGFR knockdown decreases miR-221/222 and -30b/c expression levels. In red are the up-regulated and in green the down-regulated miRs after EGFR and MET silencing. Results are representative of at least four independent experiments. P values were obtained by two-tailed student's t test. Error bars represent standard deviation.

