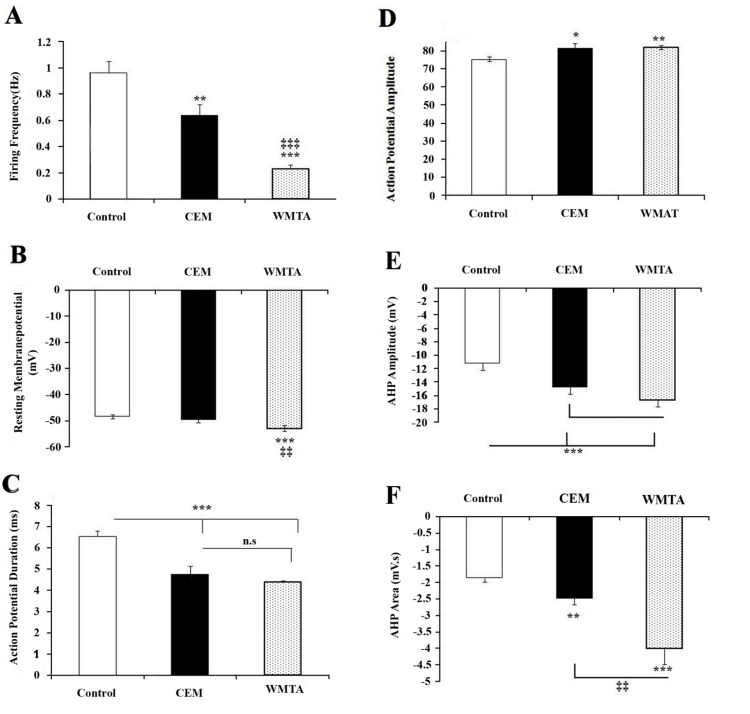
Figure 3.
Effects of bath applications of CEM and MTA on action potential characteristics. Average data (mean ± SEM) showing the effect of CEM and WMTA on firing frequency; A) resting membrane potential; B) action potential duration; C) action potential amplitude; D) after hyperpolarizations (AHP) amplitude; E) and AHP area; F) One-way ANOVA was used to analyze the data. *,**,*** = significantly different (P<0.05, P<0.01, P<0.001, respectively) from the control; ‡‡ = significant difference (P<0.01) between CEM and WMTA

