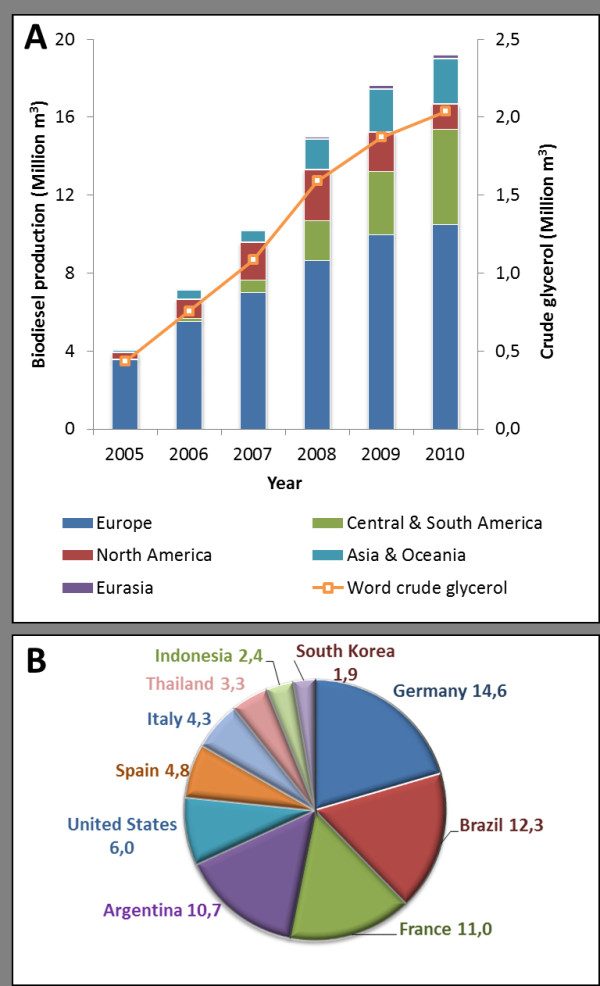
Figure 1 .

A: World biodiesel (bars) and crude glycerol (lines) production between 2005 and 2010. Biodiesel production was grouped by continents; whereas crude glycerol represents the total production in the world over the years. B: Top ten biodiesel producing countries in 2010. Their production corresponds to approximately 71.3% of the total 19.21 million cubic meters of biodiesel. Production percentage is shown for each country. The production of crude glycerol was estimated assuming 0.106 L of crude glycerol per liter of biodiesel. The above figures were derived from an interactive table generated on January 11, 2012 from U.S. Energy Information Administration, International Energy Statistics, Biofuels Production ( http://www.eia.gov/cfapps/ipdbproject/iedindex3.cfm?tid=79&pid=81&aid=1&cid=regions,&syid=2005&eyid=2010&unit=TBPD).
