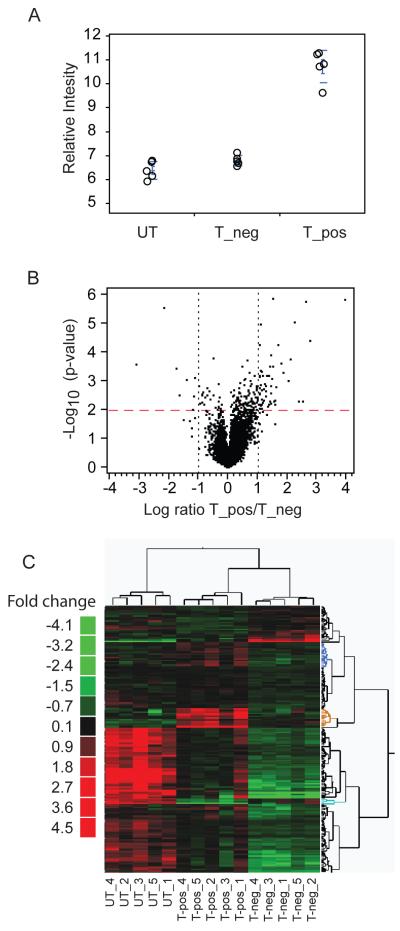
Figure 4. Identification of a TGFß dependent Foxp3 gene signature.
A. Foxp3 expression by non-TGFß-treated, activated hCD2− CD4+ T cells from Marilyn.Foxp3hCD2 mice (UT), TGFß-treated CD4+ T cells from Marilyn.Foxp3hCD2 mice which failed to express Foxp3, hCD2− (T_neg), and TGFß-treated hCD2+ (T_pos) CD4+ T cells, assessed by microarray. Data from five biological replicates is shown.
B. Volcano plot of differential genes between Foxp3 positive (T_pos) and negative (T_neg) TGFß-treated CD4+ T cells described in (4A).
C. Heat map of statistically differential transcripts derived by t-test between Marilyn.Foxp3hCD2 mice sorted on peptide and dendritic cell-stimulated TGFß-induced hCD2+ (T-pos) and cells treated with TGFß in the same cultures which failed to express Foxp3, hCD2− (T-neg) cells. The same transcripts in activated CD4+ T cells untreated with TGFβ (UT) are shown as a control. See Supplementary Table III for the identities of individual genes. Data from five biological replicates are shown.

