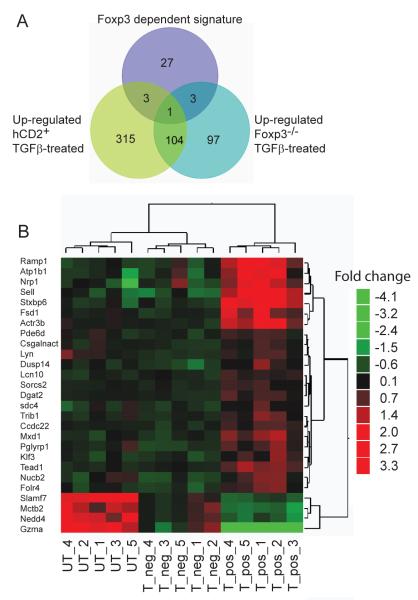
Figure 5. The TGFß driven Foxp3 induced gene signature comprises 27 genes.
A. Venn diagram showing the relationship of TGFß signatures of genes in Foxp3 positive and negative populations. CD4+ T cells from Marilyn.Foxp3hCD2 mice, TGFß treated and peptide activated and subsequently FACS sorted into hCD2+ and hCD2− groups, were compared with TGFß and peptide stimulated Foxp3−/− CD4+ T cells. Batch effects were removed and t-tests applied to identify differentially expressed transcripts between the hCD2+ and hCD2− groups. To identify a unique TGFß induced Foxp3 signature (purple circle) the differential transcripts were filtered 1) to include only those with unique expression profiles in hCD2+ cells and 2) to exclude transcripts of Foxp3-independent TGFß signatures from Foxp3−/− cells. Data are from five biological replicate samples.
B. Heat map of statistically significant Foxp3-specific TGFß signature transcripts compared between hCD2+ Foxp3 positive (T_pos) and hCD2− Foxp3 negative (T_neg) TGFß-treated CD4+ T cells and untreated (UT), activated CD4+ T cells, generated as described in (5A). Data are from five biological replicate samples.

