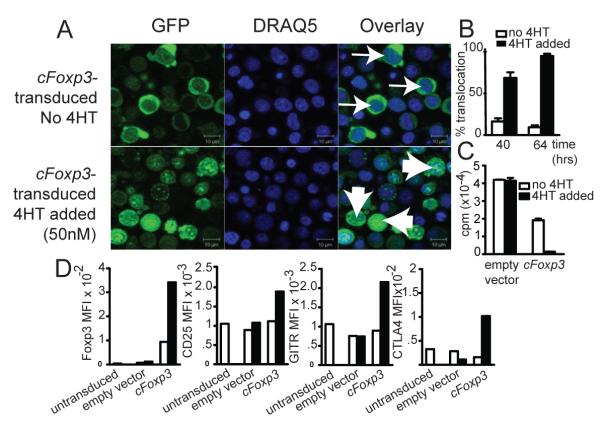
Figure 6. cFoxp3 transduced T cells display anergy and upregulate Treg markers in response to 4′HT.
A. Nuclear translocation of GFP-Foxp3-ERT2 64 h from the onset of cFoxp3 transduction, with or without inclusion of 4HT in the culture medium. FACS sorted CD4+CD25− B6 splenic T cells were prepared as per Materials and Methods .Thin arrows point to non-induced cells which show distinct localization of GFP and DRAQ-5 staining, while wide arrows point to 4HT-induced cells which show co localization. Data are representative of three separate experiments.
B. Three random microscopy fields were selected per sample for each of the time points, 40 and 60 h from the onset of transduction and cells that showed co localisation of GFP and DRAQ-5 stain were counted as having undergone nuclear translocation of the cFoxp3 encoded fusion protein. Each field examined contained at least 20 cells, with an average of 30 cells counted per field. The error bars represent standard error of the mean, for the three counted fields. Two-way ANOVA was used to compare both time-points and the two conditions (no 4HT versus 4HT added): p<0.01. Data are representative of two separate experiments.
C. Marilyn CD4+ cells were transduced with cFoxp3 or empty vector. 40 h after transduction, cells were MoFlo sorted with respect to expression of CD4 and GFP expression and incubated for a further 66 h with mitomycin C-treated HYAb pulsed female B6 BMDCs , with or without inclusion of 4HT. Cell proliferation was assessed by 3H-thymidine incorporation. The statistical significance of inhibited proliferation by nuclear Foxp3 was calculated using two-way ANOVA with Bonferonni post test: p<0.01. Data are representative of two separate experiments.
D. Conditional Treg stained for CTLA4, CD25 and GITR. FACS sorted CD4+CD25− B6 splenic T cells transduced with cFoxp3 were cultured in the absence or presence of 4HT for 64 h prior to FACS staining. Untransduced cells and cells transduced with empty vector were used as negative controls. Cells were fixed and permeabilised prior to intracellular staining for Foxp3 and CTLA4. Data are represented as mean fluorescence intensities and are representative of two separate experiments. White bars indicate cells with no 4HT added. Black bars indicate cTreg with 50nM 4HT included in the cultures.

