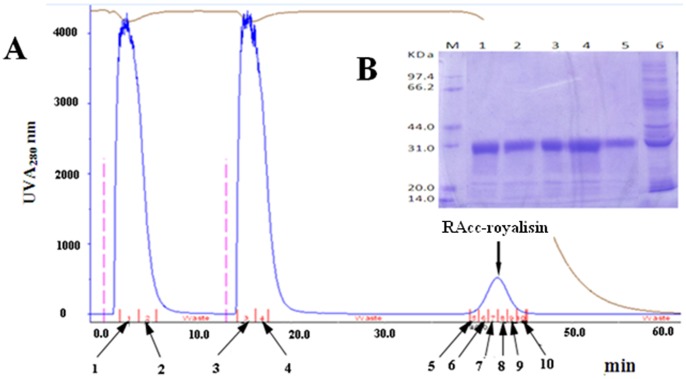
Figure 1. Purification diagram and SDS analysis of RAcc-royalisin.
(A) The diagram of RAcc-royalisin purified at UV A280 nm from the recombinant E. coli. 1–2 (indicated by arrows): The outflow peak of the first injection samples; 3–4 : The outflow peak of the second injection samples; 5–10 : The elution peak of RAcc-royalisin. (B) The SDS-PAGE pattern of the purified RAcc-royalisin. Lane M: Protein marker; Lane 1–5: The elution peak products; Lane 6: The outflow peak products.

