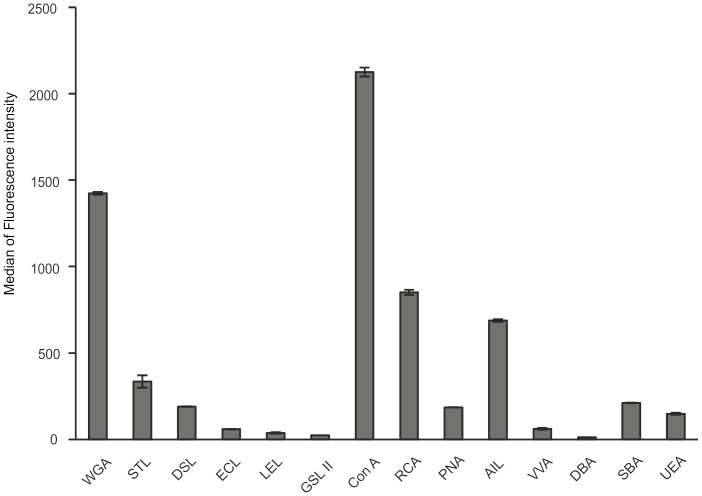
Figure 4. Expression of carbohydrate molecules on the surface of LESCs.
Lectins-based staining of carbohydrate specific molecules on the surface of LESCs. For abbreviations used see Table 2. (Data shown are mean ± S.D. of the median of fluorescence intensity, n = 3).

