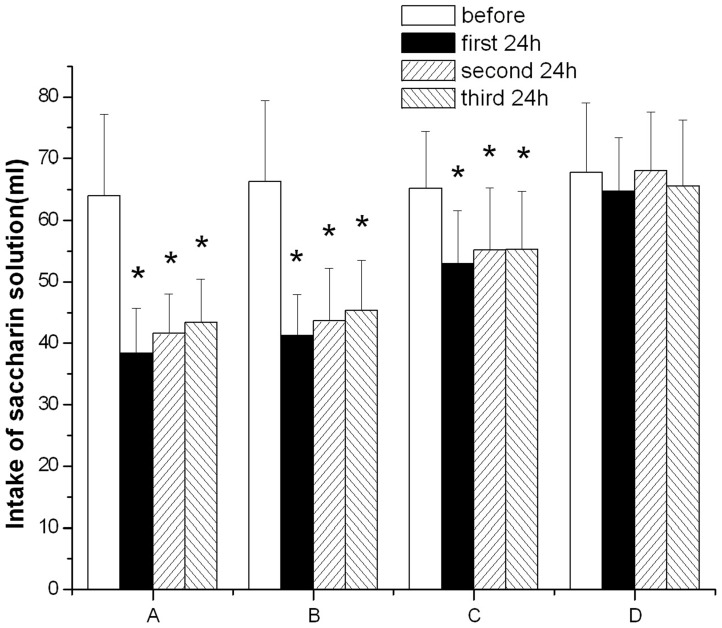
Figure 1. Comparison of intake volume of saccharin solution before and after rotary stimulation in the four experimental groups.
A: rotary stimulation undosed; B: rotary stimulation saline dosed; C: rotary stimulation anisodamine dosed; D: control group. *P<0.05 as compared with the before rotary stimulation respectively. The reduction in group C was significantly less than those of group A and group B in the three 24 h intervals after rotary stimulation.

