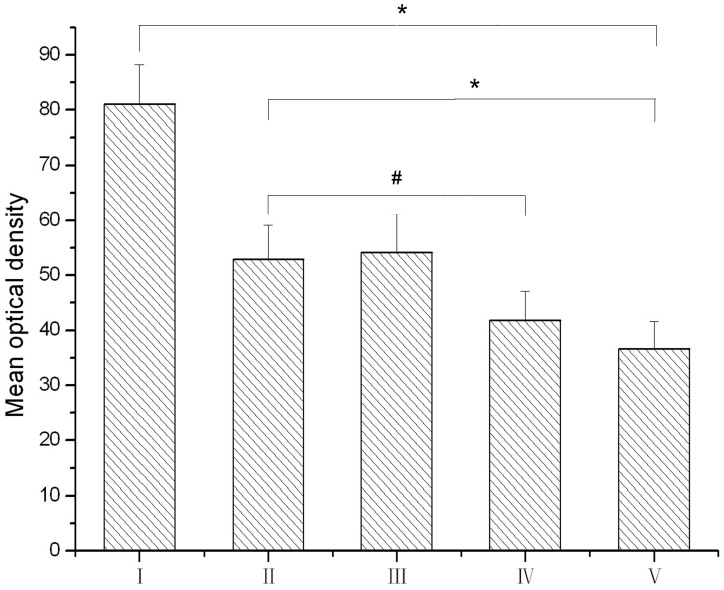
Figure 5. The mean optical density of CGRP immunoreactivity in the vestibular nuclei of rats.
I: triple rotary stimulation with undoesd; II: single rotary stimulation with undoesd; III: single rotary stimulation with saline dosed; IV: single rotary stimulation with anisodamine dosed; V: control group. *P<0.05 for group I vs. group V and group II vs. group V; #P<0.05 for group IV vs. group II.

