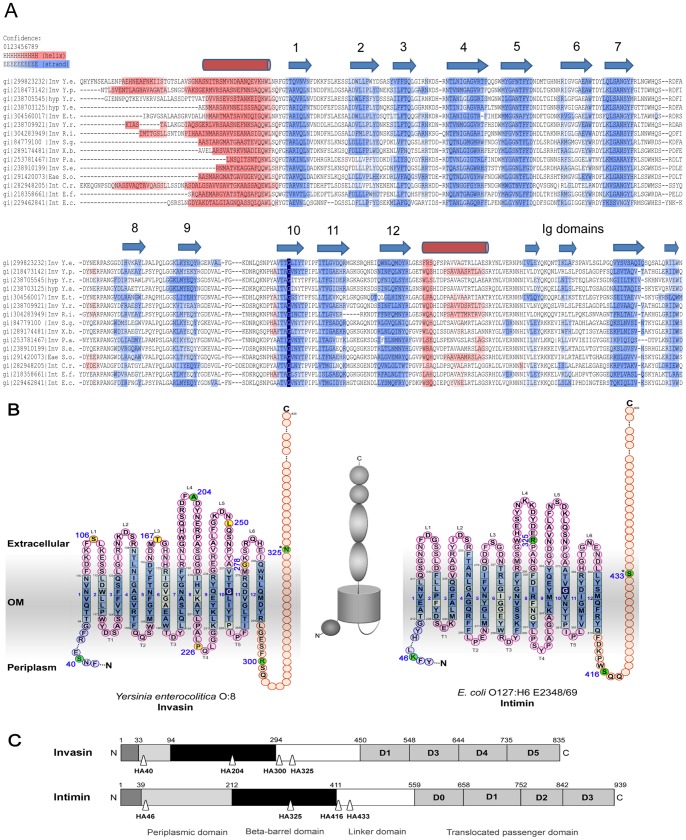
Figure 1. Schematic domain organisation and topology models of Yersinia enterocolitica O:8 invasin and E. coli O127:H6 E2348/69 intimin.
(A) Domain predictions. The amino acid sequences of the N-terminal part of each protein (excluding the extracellular passenger domain) were analysed using SignalP, PsiBLAST and HHAlign. α-helical segments (magenta) and β-strands (blue) are indicated by different colouring. The conserved glycine residue (see text) is indicated in dark blue. A scalable version of the alignment with more sequences can be found in Fig. S1. The position of the weakly predicted autotransport helix following β-strand 12 is inferred from the consensus of all sequences (for discussion, see text). (B) Topology models derived from our bioinformatical predictions are shown. β-strands are coloured blue, the interconnecting loops (extracellular) and turns (periplasmic) are drawn in pink. The α-helical linker and the C-terminal passenger domain are shown in orange. Residues after which two HA tags were introduced are coloured yellow (introduction of the tag disturbed protein biogenesis) or green (protein was produced and properly inserted into the OM) and the respective position is indicated. (S = strand, L = loop, T = turn). A schematic figure is shown in between the topology models. In the mature protein the C-terminal passenger is threaded through the N-terminal barrel and the pore is closed by the linker adjacent to the N-terminus of the passenger. (C) Domain organisation and location of HA tag insertions. The individual domains of invasin and intimin are depicted. Sites of HA tag insertions are labelled by triangles. The aa positions after which tags were introduced are indicated.

