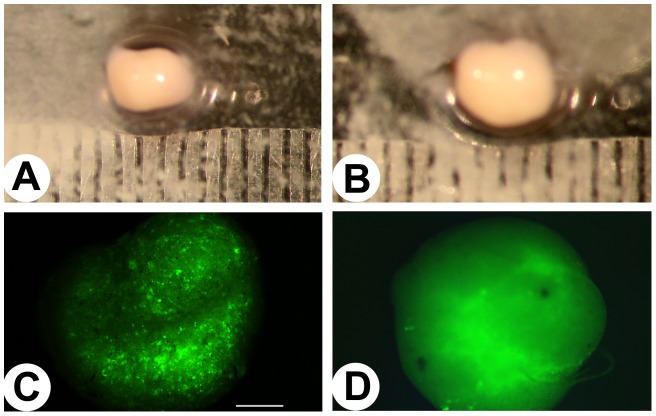
Figure 1. Morphology and GFP expression of antler stem cell-derived nodules.
A and B: Nodule morphology. A, Nodule from the S6-infected group. B, Nodule from the control (scrambled sequence) group. Note that there was essentially no difference in shape and size between theS6-infected and the control groups. C and D: GFP expression (50x). C, Nodule from the S6-infected group. D, Nodule from the control group. Note that numerous fluorescent dots could be observed from the S6-infected nodule, but the control nodule only showed faint auto-fluorescence.

