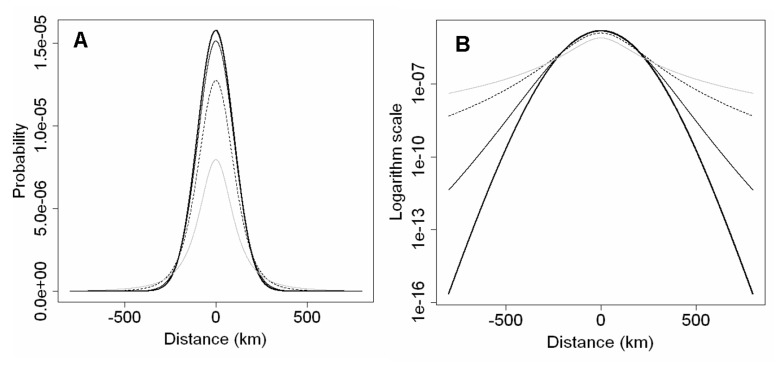
Figure 2. Four cross sections through a rotated t distribution for u = 100 km, and ν = 2 (grey line), ν = 5 (black dashed line), ν = 20 (thin black line), and ν = 100 (thick black line).
In A, the kernels are shown with linear y-scale, whereas in B the same kernels are shown with logarithmic y-scale to bring out the differences in the fatness of the tails of the distributions.

