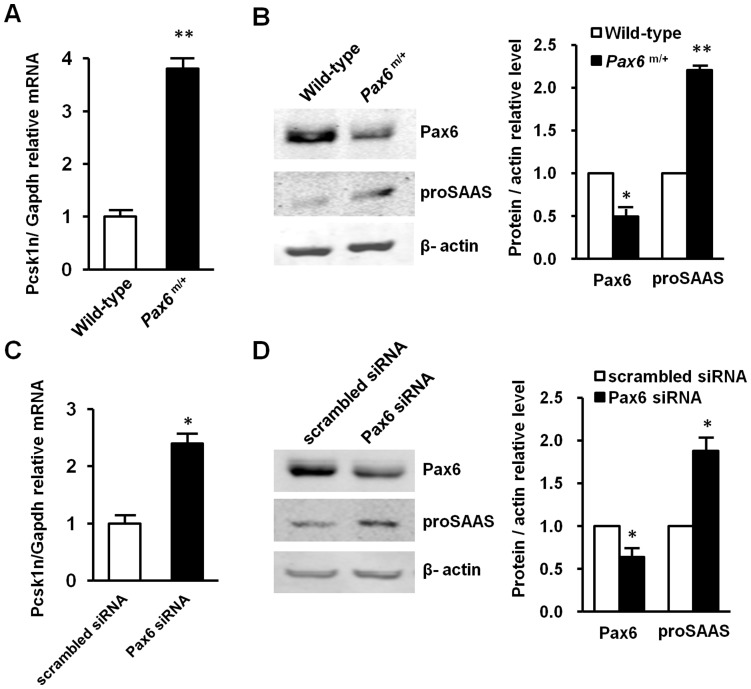
Figure 2. Decreased Pax6 led to increased Pcsk1n expression.
A, B Pax6 deficiency led to Pcsk1n up-regulation in the islets of Pax6 R266Stop mutant mice. Pcsk1n expression was detected by qRT-PCR (A) (Wild type: white bars, Pax6m/+: black bars; n = 3) or by western blotting analysis (B). Pcsk1n expression level in islets isolated from Pax6 mutant mice at age of 6 months (n = 9) were significantly higher than those in wild-type mice (n = 7). Protein quantification ratio of densitometry scanning of Pax6 m/+/Wild-type was shown right. C, D Pax6 knock-down elevated Pcsk1n expression in MIN6 cells. Pcsk1n expression was detected in MIN6 cells with Pax6 knock-down by qRT-PCR (C) (n = 3) or by western blotting analysis (D) (n = 3). Pcsk1n expression levels in MIN6 cells transfected with Pax6 siRNA (black bars) or scrambled siRNA (white bars) were identified. Quantification ratio of densitometry scanning of protein transfected withPax6 siRNA/scrambled siRNA was shown right. A representative experiment is shown; the experiment was repeated three times. Each value represents the mean ± SE. *p<0.05, **p<0.01.

