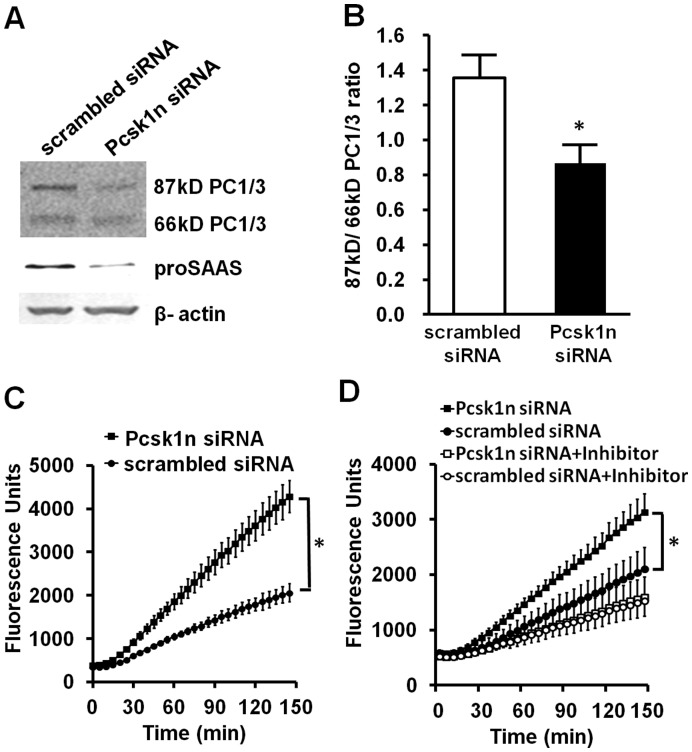
Figure 3. Down-regulation of Pcsk1n advanced C-terminal cleavage and activity of PC1/3 in MIN6 cells.
A, MIN6 cells were transfected with Pcsk1n siRNA for 48 h, and protein was collected to analyze the PC1/3 C-terminal cleavage with western blots. B, ratio of densitometry scanning of 87 kDa and 66 kDa PC1/3 bands was analyzed using MIN6 cells transfected with Pcsk1n siRNA (black bar) or scrambled siRNA (white bar) (n = 3). C, enzyme activity was analyzed using MIN6 cells transfected with Pcsk1n siRNA (black circles) or scrambled siRNA (white circles) with equivalent protein (n = 3). D, the specificity of enzyme activity measured was tested by PC1/3 specific inhibitor Ac-LLRVKR-NH2 using MIN6 cells. Black squares, Pcsk1n siRNA; Black circles, scrambled siRNA; White squares, Pcsk1n siRNA + inhibitor; White circles, scrambled siRNA + inhibitor. A representative experiment is shown; the experiment was repeated three times. Each value represents the mean ± SE. *p<0.05.

