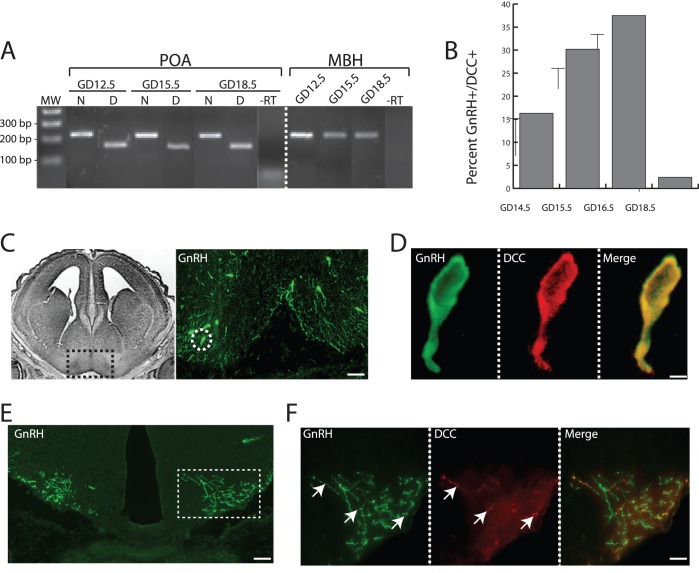
Figure 1. Expression of Netrin-1 and its receptor DCC in developing GnRH neurons and target areas.
(A) Composite image showing agarose gel electrophoresis of PCR products. PCR from the preoptic area (POA), across all ages examined (GD 12.5, 15.5, 18.5), showed a band of 219 bp arising from Netrin-1-specific primers (lanes marked with N), and a band of 174 bp arising from DCC-specific primers (lanes marked with D). MW, molecular weight marker. PCR from the mediobasal hypothalamus (MBH) was performed with primers for Netrin-1 only, and again a band of 219 bp is clearly visible. –RT, negative control lanes showing that there are no PCR products from reactions in which the reverse transcription reaction contained no reverse transcriptase, and verifying the specificity of the reactions and the absence of spurious products. (B) Bar graph showing the mean percentage of GnRH-immunoreactive neurons that were also immunoreactive for DCC across the three gestational ages when GnRH neurites are growing to the median eminence. Error bars indicate SEM. (C) Left, black and white image modified from The Chemoarchitectonic Atlas of the Developing Mouse Brain [52] section of GD 16 mouse brain, and depicting the anatomical level from which the immunostained section (right) was taken. Black box indicates region that is shown in the accompanying immunofluorescence photo. Right, representative image of GD 16.5 coronal brain section showing immunostained GnRH (green) neurons (arrows). Dotted white circle indicates one GnRH neuron that is shown dual-labeled with DCC and at higher magnification in (D). Scale bar, 100 µm. (D) High magnification of a single GnRH neuron showing dual-labeling for GnRH peptide (green), DCC (red), two channels merged (yellow). Scale bar, 10 µm. (E) Representative image of GD 16.5 coronal brain section at the level of the ME, and showing immunostained GnRH nerve fibers (green). Dotted box demarcates stained fibers, and indicates the area that is shown in higher magnification in (F). Scale bar, 100 µm. (F) High magnification of GnRH nerve fibers at the ME showing dual-labeling for GnRH peptide (green), DCC (red), and the two channels merged. Arrows indicate GnRH fibers that are co-expressing DCC protein. Scale bar, 10 µm.

