Fig. 2.
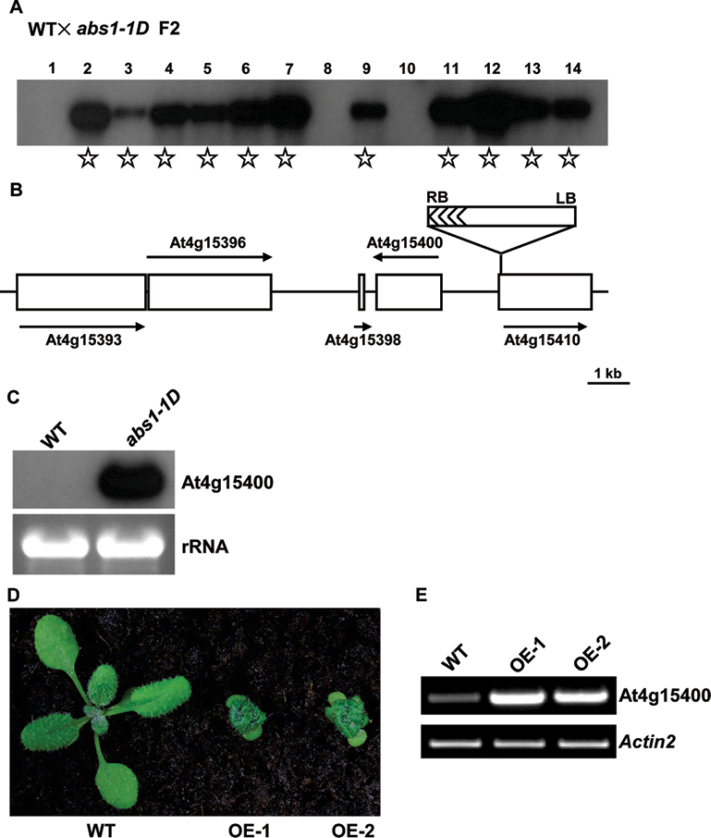
Cloning of the ABS1 gene. (A) Co-segregation analysis of abs1-1D. Fourteen F2 plants derived from a cross between wild type and abs1-1D were randomly selected to score phenotype. Genomic DNAs from these plants were digested with BamHI. A Southern blot was probed with a 32P-labelled BAR gene sequence (Yu et al., 2008). Samples from plants showing the abs1-1D phenotype are indicated with stars. (B) Schematic representation of the T-DNA insertion site in abs1-1D. The positions of genes in the vicinity of the T-DNA are shown as open boxes. Arrows represent the orientation of the open reading frames of these genes. (C) Accumulation of At4g15400 transcripts in wild-type and abs1-1D plants. Equal amounts of total RNA (5 μg) extracted from 2-week-old seedlings were separated on a formaldehyde gel and transferred to a nylon membrane. The RNA blot was hybridized with 32P-labelled full-length At4g15400 cDNA. The ethidium bromide-stained RNA gel shown below served as a loading control. (D) Phenotypes of representative 2-week-old wild-type and two independent transgenic lines overexpressing At4g15400 (OE-1, and OE-2). (E) Semi-quantitative RT-PCR analysis of At4g15400 transcript accumulation in the plants shown in (D). All primers and RT-PCR conditions used in this study are listed in Supplementary Table S1. Actin2 expression was used as a control.

