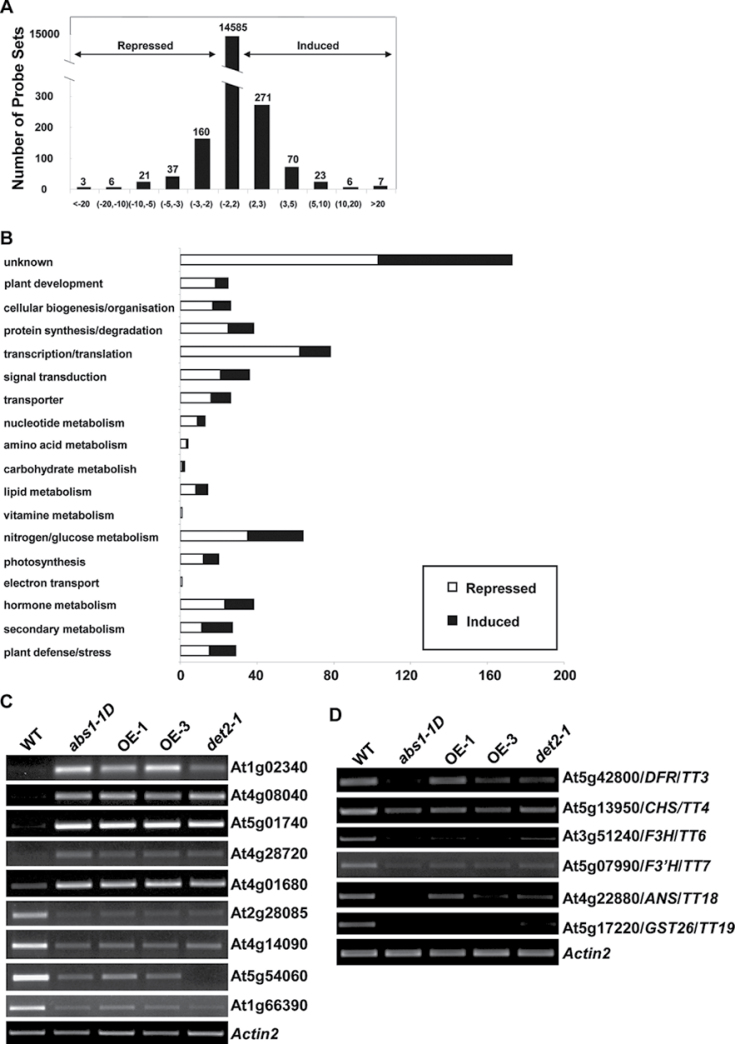
Fig. 7.
Global transcriptome profiling of abs1-1D. (A) Distribution of genes with altered expression in abs1-1D compared with the wild type. (B) Functional classification of genes that are significantly repressed or induced (by at least twofold) in abs1-1D versus wild-type plants. (C) Semi-quantitative RT-PCR analysis of expression of the major up- and downregulated genes shown in microarray data in wild type, abs1-1D, two ABS1 overexpression lines (OE-1 and OE-3), and det2-1. (D) Semi-quantitative RT-PCR analysis of the expression of indicated flavonoid biosynthesis genes from the same samples as in (C). Actin2 expression was used as a control.

