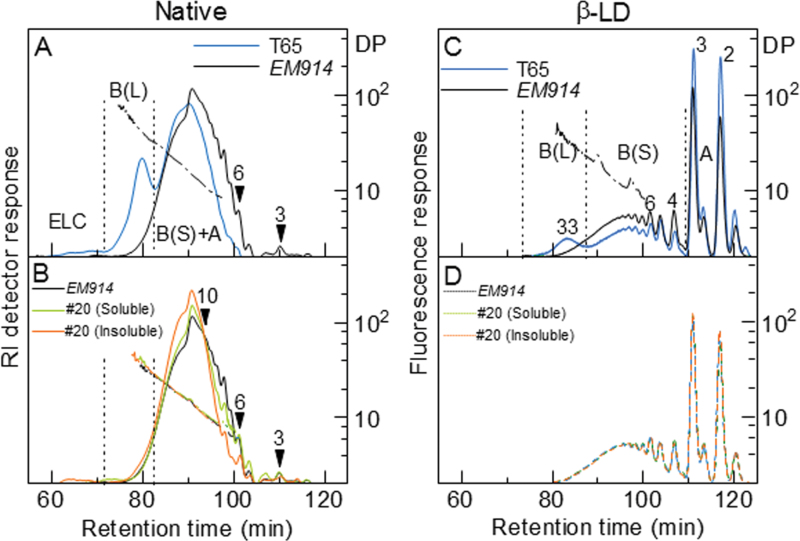
Fig. 5.
Chain length distributions of α-glucans and their β-amylase limit dextrins (β-LDs) analysed by HPSEC after labelling with 2-aminopyridine. Solid and dashed line, RI detector (left panels) or fluorescence detector (right panels) response; dash-dot-dash line, DP; number with arrowhead, DP at the specified elution position. These DPs were determined either directly from the ratio of detector responses (RI/fluorescence) or by comparisons with authentic malto-oligosaccharides with known DPs (in the range of DP ≤6). Detector responses are normalized by weight (left panels) or moles (right panels). (A) Amylopectin from the wild-type japonica line T65 and phytoglycogen from the congenic isa1 mutant line EM914. (B) isa1 phytoglycogen and soluble and insoluble α-glucan of SSIIa I /isa1-#20. (C) β-LDs of T65 and EM914. (D) β-LDs of EM914 and soluble and insoluble α-glucan of SSIIa I /isa1-#20.

