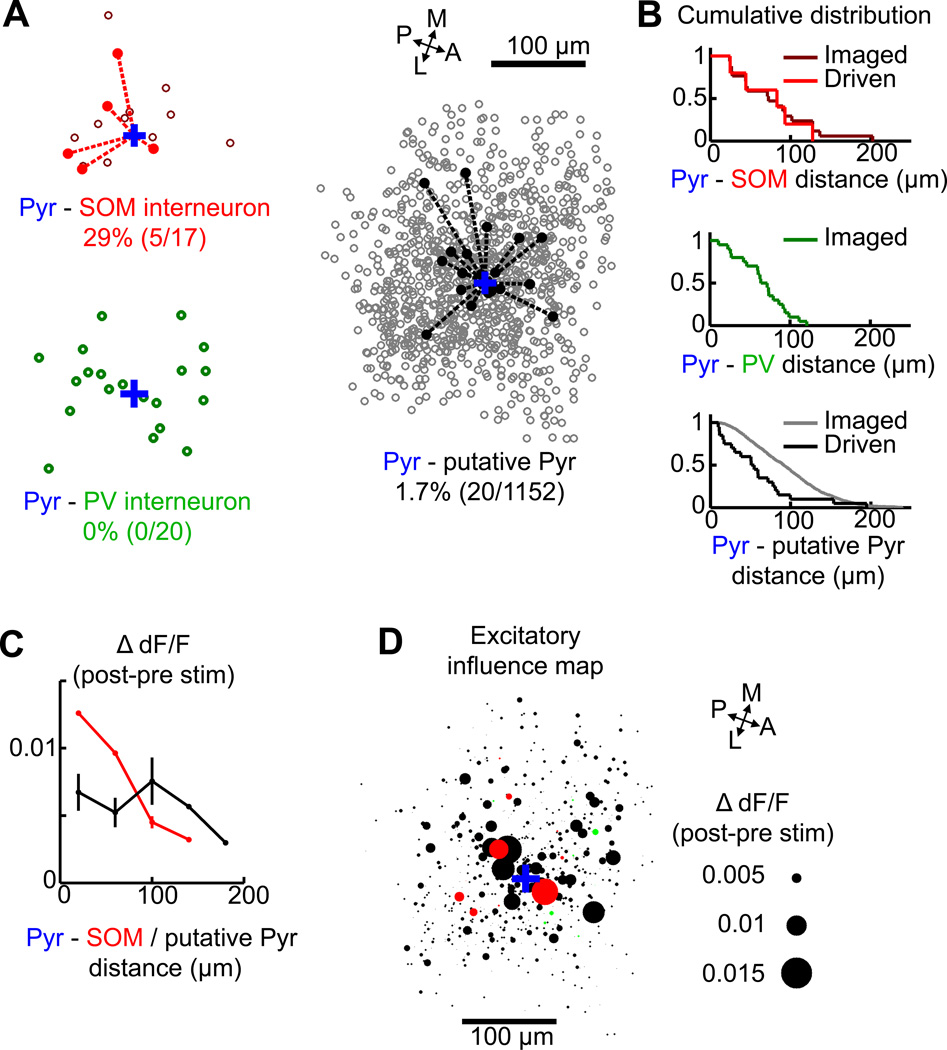
Figure 7. Spatial maps of the functional connections.
(A) Spatial x–y distribution of imaged (open circles) and connected (filled circles and dotted lines) neurons with significant ΔdF/Fpost-pre for each cell type relative to the patched neuron (blue cross). A-P, anterior-posterior; M-L, medial-lateral. (B) Distributions of distance from the patched cell to each type of imaged and connected neurons. (C) Distance dependence of response amplitude for functionally connected SOM interneurons (red) and putative pyramidal neurons (black). (D) Excitatory influence map of the imaged neurons with ΔdF/Fpost-pre > 0 (red, SOM; green, PV; black, unidentified). Each circle represents a cell and the diameter represents the magnitude of ΔdF/Fpost-pre.

