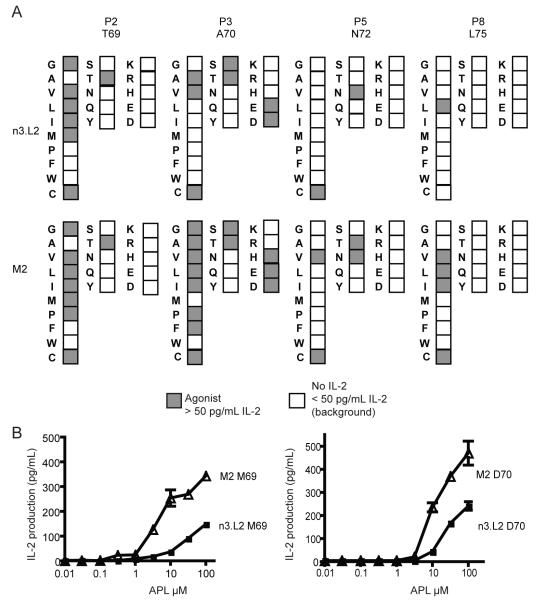
Figure 4. Response of n3.L2 and M2 hybridomas to Hb(64-76) APLs.
A. All 20 amino acids were substituted individually into each of the 4 TCR contact positions in the Hb(64-76) peptide (P2, P3, P5 and P8). Wildtype Hb(64-76) residues are noted under the label for each position. APLs that induced IL-2 production are shaded. Each APL was tested in triplicate up to 100μM in at least 3 independent experiments. B. Stimulation of IL-2 production by n3.L2 (closed square) and M2 (open triangle) with M69 (left) and D70 (right) as examples of differences in APL response. Mean + SEM is presented for the full dose curve which is representative of 4 independent experiments.

