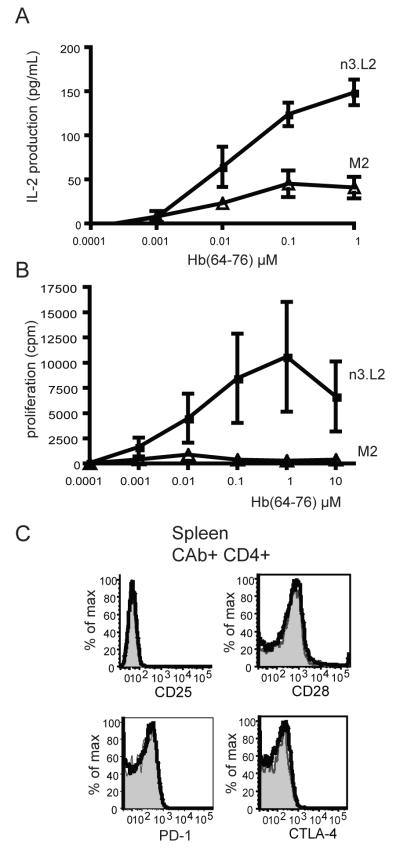
Figure 7. M2 CD4 T cells are hyporesponsive to Hb(64-76).
A. Rag1−/− CAb+ CD4+ cells isolated from n3.L2 (closed squares) and M2 (open triangle) mice were cultured in triplicate overnight with irradiated B6.K splenocytes pulsed with indicated concentrations of purified Hb(64-76) peptide. After 18-20 hrs, IL-2 production was assayed by ELISA. Dose curves are mean + SEM of triplicate samples from 3 independent experiments. B. The same cells assayed for IL-2 production in panel A were maintained in culture for an additional 72 hrs to measure proliferation of isolated n3.L2 (closed squares) and M2 (open triangle) cells by 3H incorporation. Dose curves are mean + SEM of triplicate samples from 3 independent experiments. C. Levels of costimulatory and inhibitory molecules on the surface of naive CAb+ CD4+ cells from the spleen of n3.L2 (black line) and M2 (filled histogram) TCR transgenic mice. Representative plots from 5 mice in 3 independent experiments.

