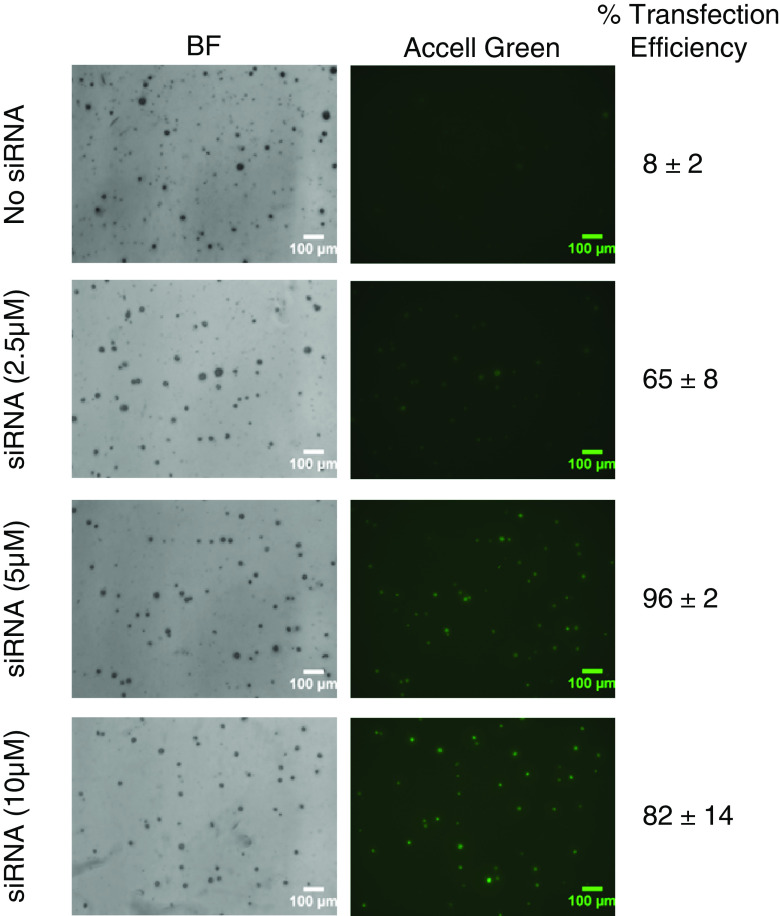
Fig. 3.
Representative photomicrographs showing expression of Accell Green in primary breast cancer cells. Shown are merged z-stacks for bright field (BF) and fluorescence (Accell Green) images. Treatment groups include No siRNA and Accell Green siRNA (2.5 μM, 5 μM, and 10 μM). Fluorescence Accell Green signal appears as gray areas

