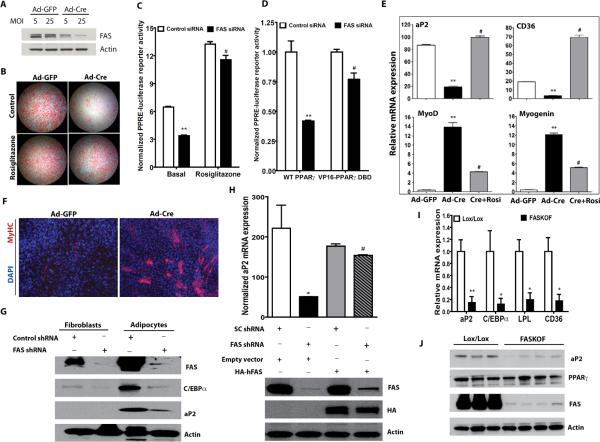
Figure 3. FAS is Required for Adipogenesis and PPARγ Activation.
(A) Western blot analysis of FAS knockdown in primary MEFs from FASlox/lox mice treated with an adenovirus expressing GFP or Cre at the indicated multiplicity of infection (MOI).
(B) Oil red O staining of FASlox/lox MEFs treated with Ad-GFP or Ad-Cre and differentiated to adipocytes in the presence or absence of rosiglitazone.
(C) HEK 293 cells treated with control or FAS siRNA were transfected with plasmids encoding PPRE-luciferase, Renilla luciferase and wild type PPARγ in the presence or absence of rosiglitazone. **P<0.0001 vs. control, #P<0.0001 vs. FAS siRNA basal. N=3/condition.
(D) HEK 293 cells treated with control or FAS siRNA were transfected with plasmids encoding PPRE-luciferase, Renilla luciferase and wild type PPARγ or VP16-PPARγ DBD (an N-terminal fragment of PPARγ encompassing the DNA binding domain fused to the VP16 transactivation domain). **P<0.0001 vs. control, #P<0.0001 vs. FAS siRNA/WT PPARγ. N=3/condition.
(E) RT-PCR analysis of gene expression in FAS-deficient (Ad-Cre-treated) or control (Ad-GFP-treated) MEFs subjected to the adipogenesis protocol. **vs. Ad-GFP, P=0.0060 for aP2, 0.0010 for CD36, 0.0051 for MyoD, 0.0007 for Myogenin. #vs. Ad-Cre, P=0.0015 for aP2, 0.0013 for CD36, 0.0099 for MyoD, 0.0019 for Myogenin.
(F) FAS-deficient (Ad-Cre-treated) or control (Ad-GFP-treated) MEFs cultured to promote myogenesis and stained with a skeletal muscle myosin heavy chain antibody.
(G) Detection of proteins induced by PPARγ in 3T3-L1 fibroblasts and adipocytes treated with control or FAS shRNA.
(H) Restoration of PPARγ target gene expression with human FAS using 3T3-L1 adipocytes with endogenous knockdown of FAS. 3T3-L1 cells stably expressing retrovirally encoded human FAS were infected with a lentivirus expressing scrambled control (SC) or mouse FAS shRNA. The cells were induced to differentiate into adipocytes. The upper panel shows real-time PCR analysis of aP2 expression and the bottom panel shows a Western blot with antibodies against FAS, HA and actin. *P=0.0224 (vs. SC shRNA, empty vector). #P<0.0001 (vs. FAS shRNA, empty vector).
(I) RT-PCR analysis of gene expression in control and FASKOF gonadal WAT. **P=0.007. *P=0.0493 for C/EBPα, 0.010 for LPL, 0.039 for CD36. N=4/genotype.
(J) Western blot analysis in gonadal WAT of ZFD-fed control and FASKOF female mice. Each lane represents a separate mouse.
Error bars in panels C–E and H–I represent SEM.

