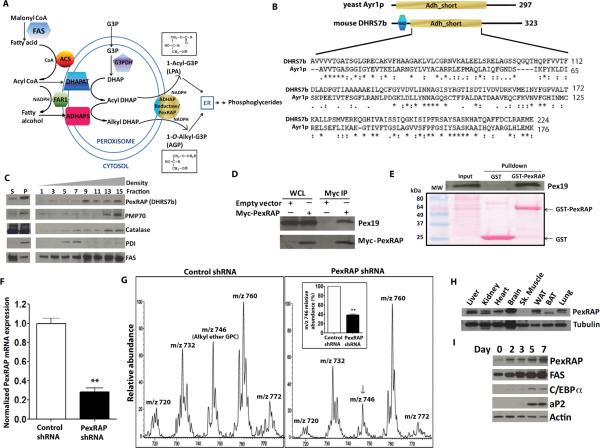
Figure 5. Cloning and Characterization of the Terminal Component in the Mammalian Peroxisomal Ether Lipid Synthetic Pathway.
(A) The peroxisomal acyl-DHAP pathway of lipid synthesis. FAS, fatty acid synthase; ACS, acyl CoA synthase; G3PDH, glycerol 3-phosphate dehydrogenase; DHAP, dihydroxyacetone phosphate; DHAPAT, DHAP acyltransferase; FAR1, fatty acyl CoA reductase 1; ADHAPS, alkyl DHAP synthase; ADHAP Reductase, acyl/alkyl DHAP reductase activity; LPA, lysophosphatidic acid; AGP, 1-O-alkyl glycerol 3-phosphate.
(B) Mouse DHRS7b is homologous to yeast acyl DHAP reductase, Ayr1p. TMD, transmembrane domain; Adh_short, short chain dehydrogenase/reductase domain.
(C) PexRAP (Peroxisomal Reductase Activating PPARγ, detected using anti-DHRS7b antibody) is enriched in peroxisomal fractions isolated from 3T3-L1 adipocytes. S, supernatant; P, pellet after sedimentation.
(D) Pex19 co-immunoprecipitates with Myc-tagged PexRAP. WCL, whole cell lysates.
(E) Pex19 interacts with PexRAP in GST pulldown experiments using 3T3-L1 adipocytes.
(F) RT-PCR analysis of PexRAP expression with PexRAP knockdown in MEFs. **P=0.0084.
(G) Mass spectrometric analyses of [M+H]+ ions of GPC lipids in MEFs after PexRAP knockdown. Quantification of the 1-O-alkyl ether GPC lipid peak at m/z 746 [M+H]+ (identical to the lithium adduct at m/z 752 in Figure 4C) is shown in the inset. **P=0.0009.
(H) Mouse tissue distribution of PexRAP protein by Western blotting.
(I) Protein abundances of PexRAP and FAS increase prior to increases in C/EBPα and aP2 during differentiation of 3T3-L1 adipocytes.
Error bars in panels F and G (inset) represent SEM.

