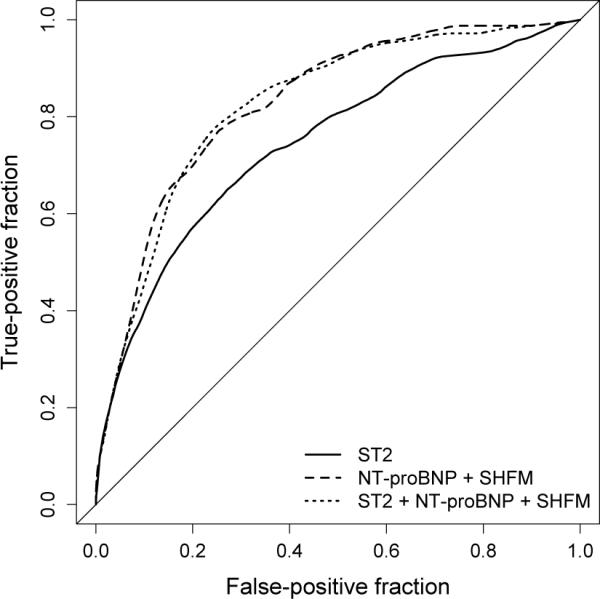
Figure 1.

Estimated time-dependent ROC curves for transplant-free survival at one year: ST2 (` ') the composite marker for NT-proBNP and SHFM (`
 '); and the composite marker for ST2, NT-proBNP, and SHFM (`
 ').
').

Estimated time-dependent ROC curves for transplant-free survival at one year: ST2 (` ') the composite marker for NT-proBNP and SHFM (`
 '); and the composite marker for ST2, NT-proBNP, and SHFM (`
 ').
').