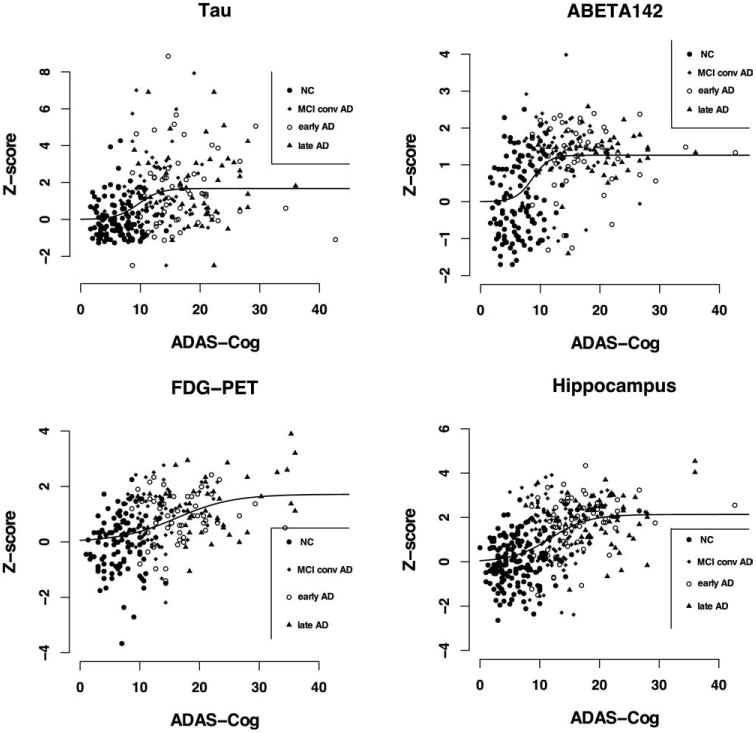
Fig. 2.

For each biomarker, individual Z scores are plotted against ADAS-Cog scores, and the fitted sigmoid curve is displayed. Full circles denote healthy controls, full squares MCI patients converted to AD, empty circles early AD, and full triangles late AD patients. Sigmoid fitting was better than linear fitting for Tau, Aβ 1–42 and hippocampus (for the latter: sigmoid nonsignificantly better than linear); linear fitting was better for FDG-PET.
