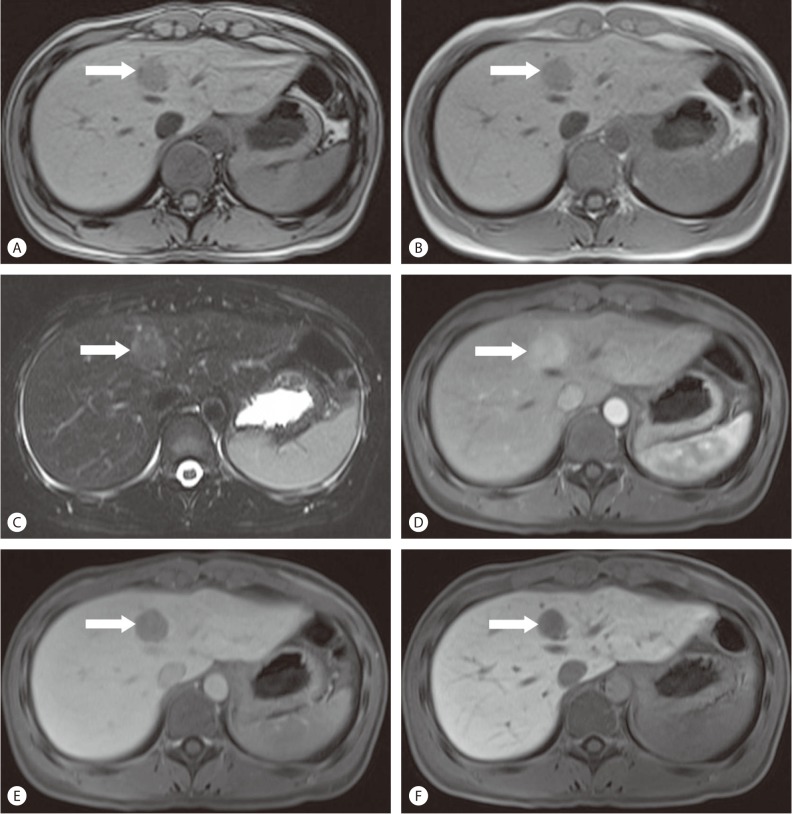
Figure 3.
Liver MRI findings. (A) T1-weighted out-of phase image shows a small focus of signal loss (arrow) in the peripheral portion of the mass, (B) Compared to the in-phase images, indicating a fat component. (C) On T2-weighted image, the mass shows to be a relatively homogenous and moderately hyperintense lesion. (D) Dynamic contrast-enhanced MRI using gadoxetate disodium shows intense and homogeneous enhancement of the tumor (arrow) on arterial phase, (E) Washout of the tumor on delayed phase and (F) Low signal intensity of the mass compared to the increased signal intensity of the surrounding hepatic parenchyma on hepatobiliary phase.

