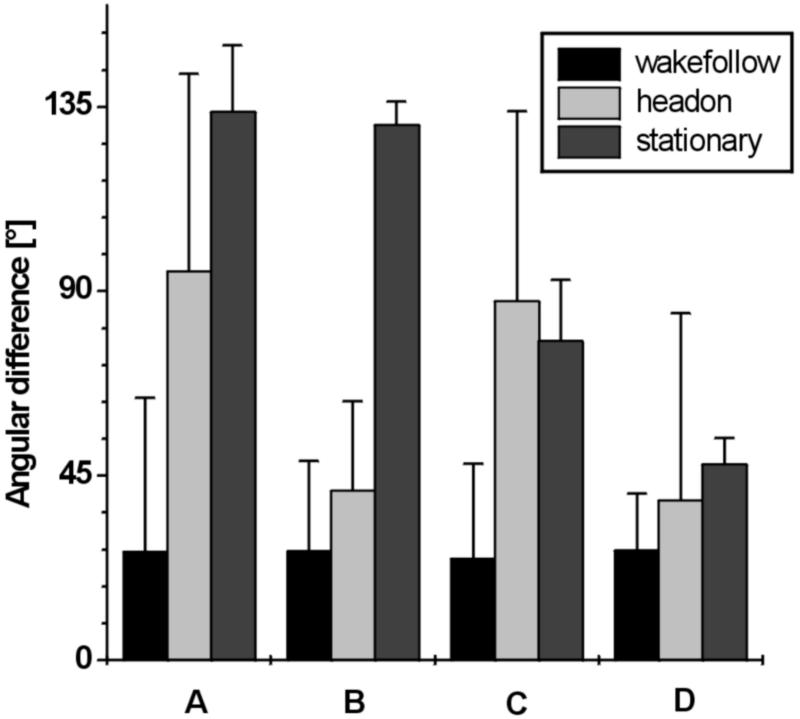
Figure 3.
Means and standard deviations of differences in swimming direction of predator and prey before attacks, comparing three attack categories: path-following, head-on encounters, and attacks on stationary guppies. A, medians in xy plane. B, quartile differences in xy plane. C, medians in xz plane. D, quartile differences in xz plane.

