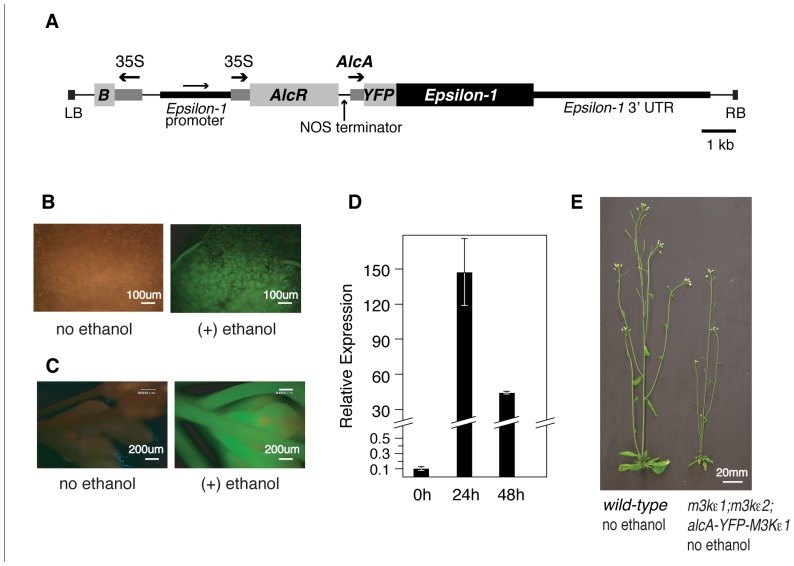
FIGURE 1.
Using an alcohol-inducible promoter construct to generate map3kε1-/-;map3kε2-/- double-mutant plants. (A) Plasmid map of the T-DNA portion of the alcohol-inducible YFP-MAP3Kε1 expression construct. Arrows indicate the direction of transcription for each of the promoters. The MAP3Kε1 native promoter is present on the construct as an artifact of the cloning procedures used to assemble this plasmid. “B” indicates the coding region for the Bar gene that serves as a plant-selectable marker by encoding resistance to the herbicide Basta. “LB” and “RB” indicate the T-DNA left border and right border sequences. “35S” indicates the cauliflower mosaic virus 35S promoter. “AlcA” indicates the alcohol-inducible promoter element. Scale bar indicates 1 kb. (B,C) Epifluorescence images of a rosette leaf (B) or an inflorescence (C) of an map3kε1-/-;map3kε2-/-;alc-YFP-MAP3Kε1 plant before and after exposure to exogenous ethanol. Images were collected 24 h after ethanol treatment. Green color indicates YFP fluorescence. Red color is due to autofluorescence of the plant tissue. (D) Two-week-old map3kε1-/-;map3kε2-/-;alc-YFP-MAP3Kε1 seedlings carrying the alcA:YFP-MAP3Kε1 construct were sprayed with ethanol to induce YFP-MAP3Kε1 expression. RNA was isolated at the indicated time points. “Relative expression” indicates the RNA level of YFP-MAP3Kε1 transcripts relative to MAP3Kε1 in wild-type control seedlings not carrying the alcA:YFP-MAP3Kε1 construct. Standard deviation is based on three independent replicates of real-time quantitative RT-PCR. Expression of YFP-MAP3Kε1 the zero-hour time point prior to ethanol treatment was at a level of 0.1 compared to wild-type MAP3Kε1 in control seedlings. (E) Representative 3-week-old wild-type Columbia and map3kε1-/-;map3kε2-/-;alc-YFP-MAP3Kε1 plants grown in soil without exposure to exogenous ethanol.

