
Figure 1.
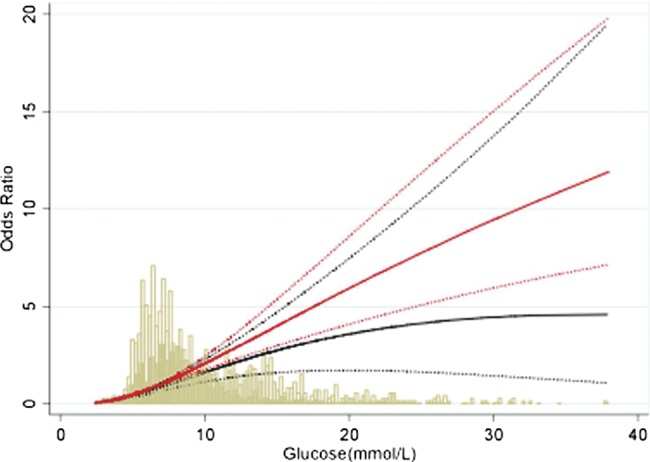
Unadjusted odds of 30-day mortality according to admission blood glucose concentration in people with and without diabetes. The bars represent the number of people at various glucose levels. Solid lines indicate OR while dotted lines indicate 95% CI. Solid bars and black lines indicate patients with diabetes. Clear bars and red lines indicate patients without diabetes.