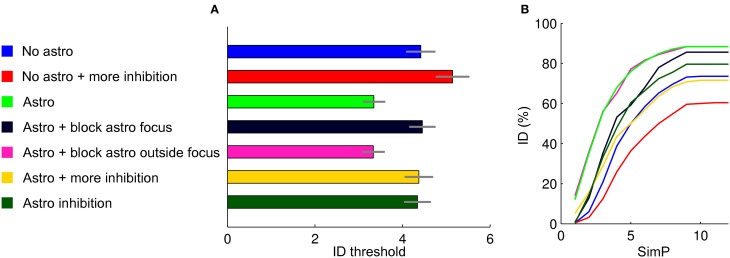
Figure 6.
Summary of the results. (A) ID threshold histogram in the different conditions. The distributions were described by fitting with Poisson distributions and determining the average values and relative errors. (B) Cumulative sum of the ID threshold histograms to show more in details how, for the different conditions tested, the threshold and the number of failures in generating an ID change.

